Displaying Chart Values
When you export your completed Piktochart visual as an image, the values/data represented on your chart will not appear by default. You can choose to activate your data labels and tooltips independently.
Here's how:
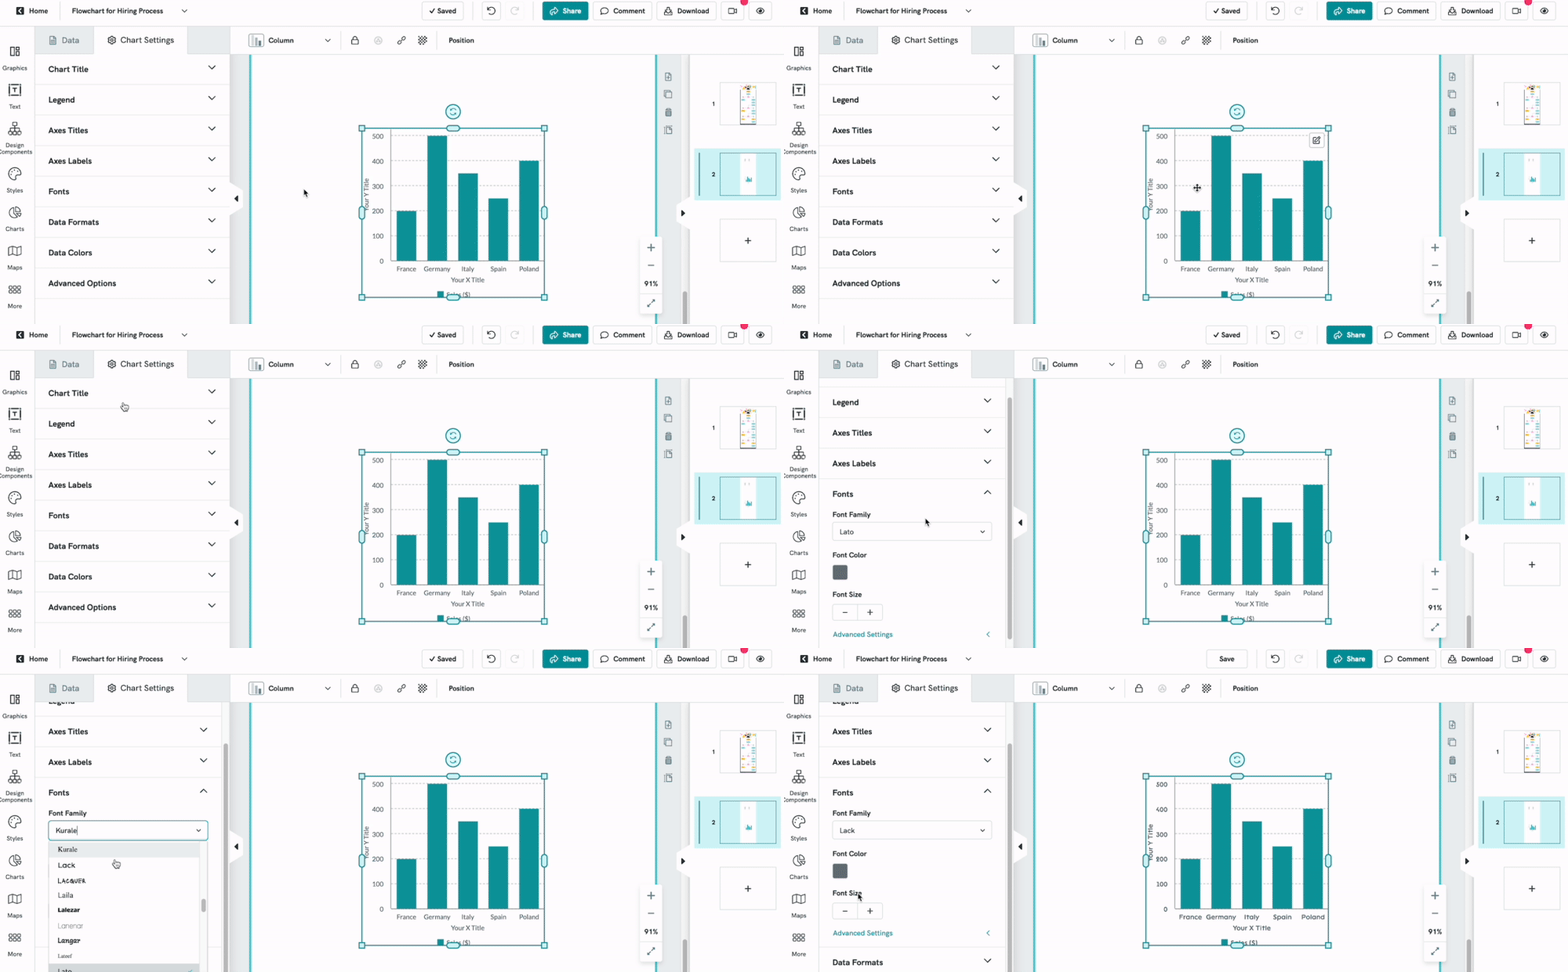
Under the Chart Settings tab, click Advanced Options for more customizable settings.
Toggle the Data Labels option ON. Data/Values will appear in the Editor version as well as on the exported file. The data/values will not be interactive.

Customize Colors of Data Label
You can customize the colors of the Data Label from the Color Tile.

Customize Data Label Font
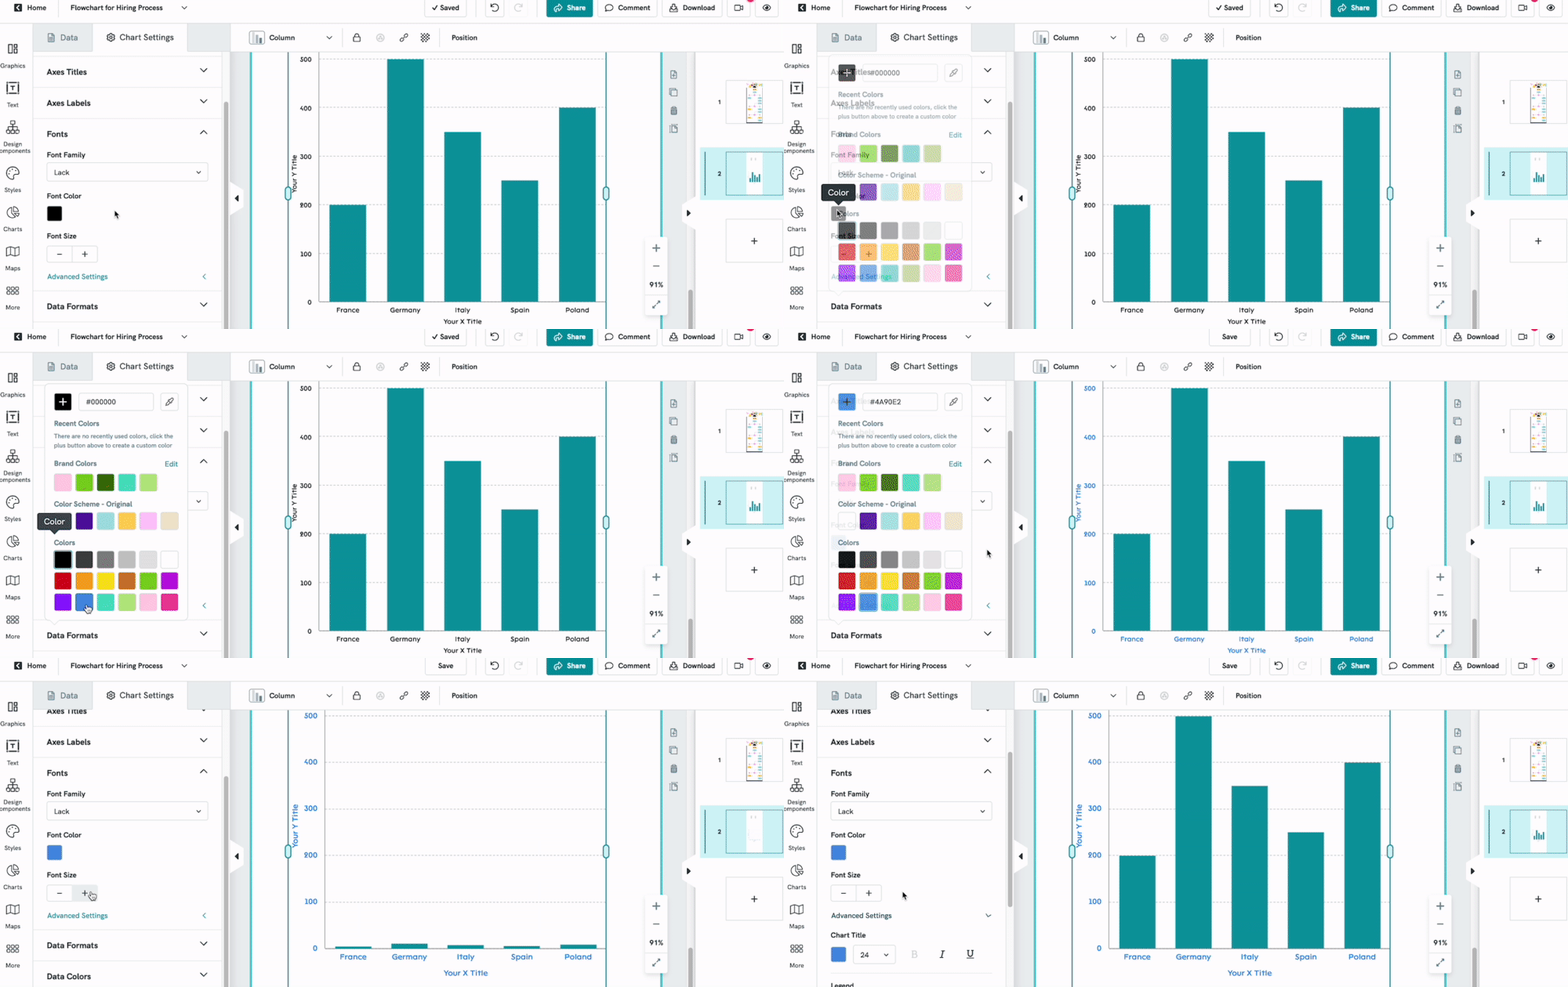
You can also customize the font in your chart! Customize the font type, text color, and font size as shown below:

Choose the Advanced Settings option to customize the font for different sections in the chart, such as the Chart Title, Legend, Axes Titles, and more.

