Troubleshooting: Console, Network tab or HAR file
To help our developers get a better understanding of a complex issue, we may ask you to provide a screenshot of the console, network tab or a HAR file. Providing these screenshots will provide the development team with further information about your local environment.
We will be using Chrome for this example, but the process will be very similar to any other browser you may be using.
Steps to take a screenshot for the Console Tab:
- 1
-
Make sure you’re on the page where the issue is happening
- 2
-
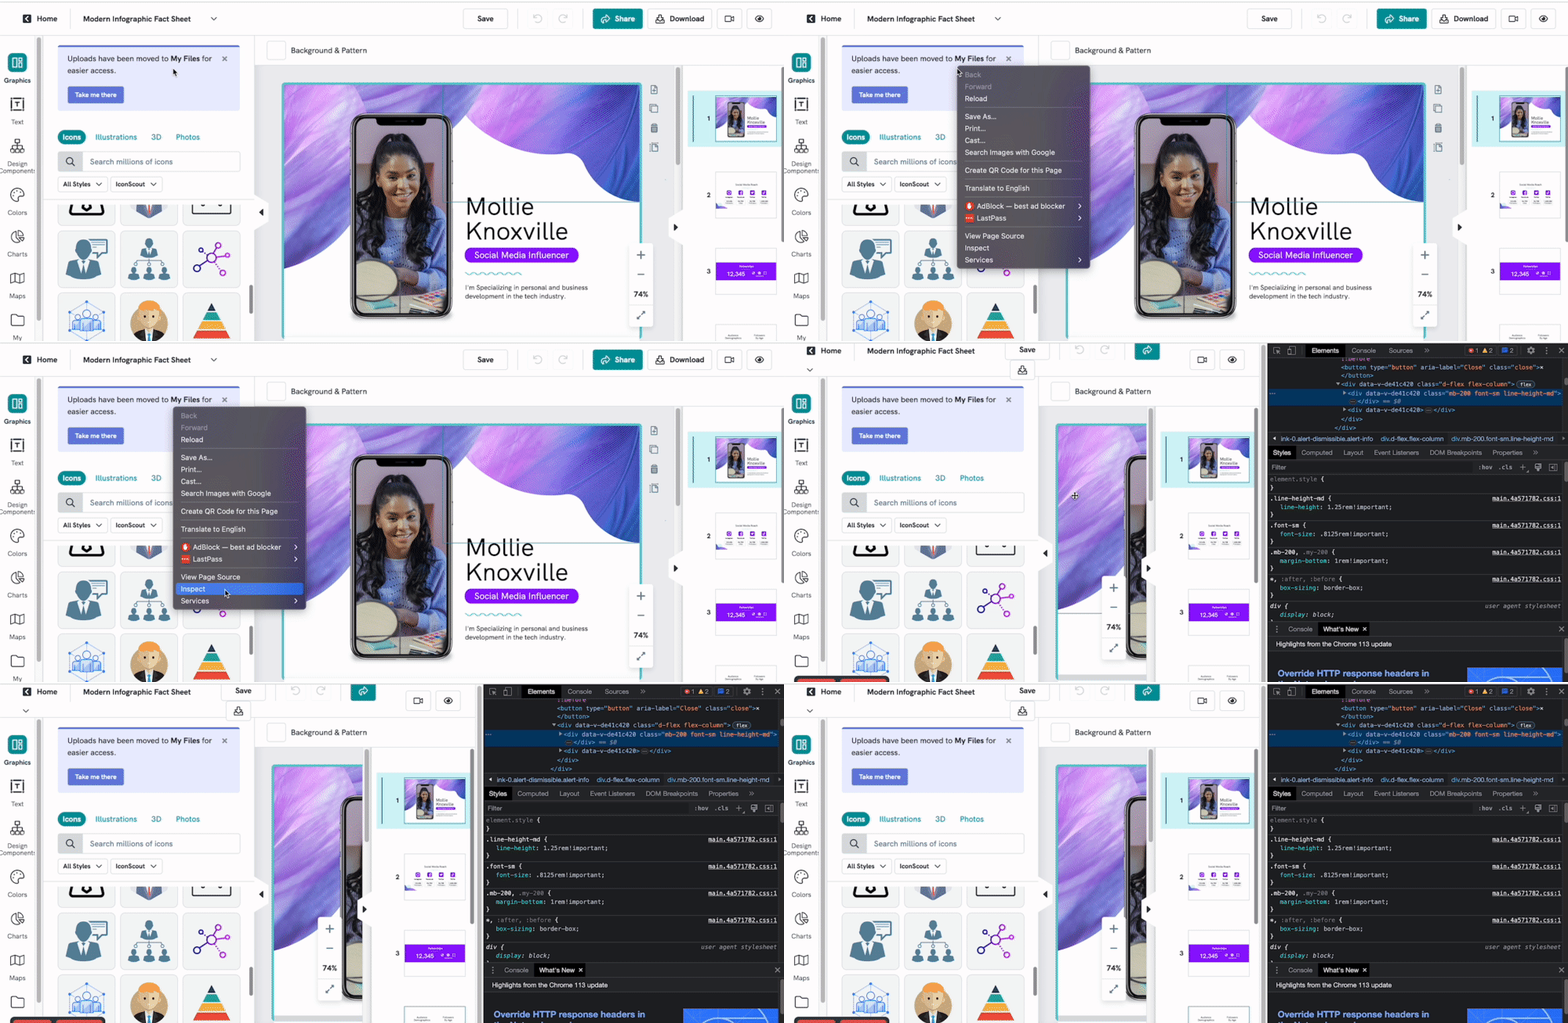
Once you have run into the issue, right-click with your mouse on the page and a window will pop up.
- 3
-
Click on Inspect
- 4
-
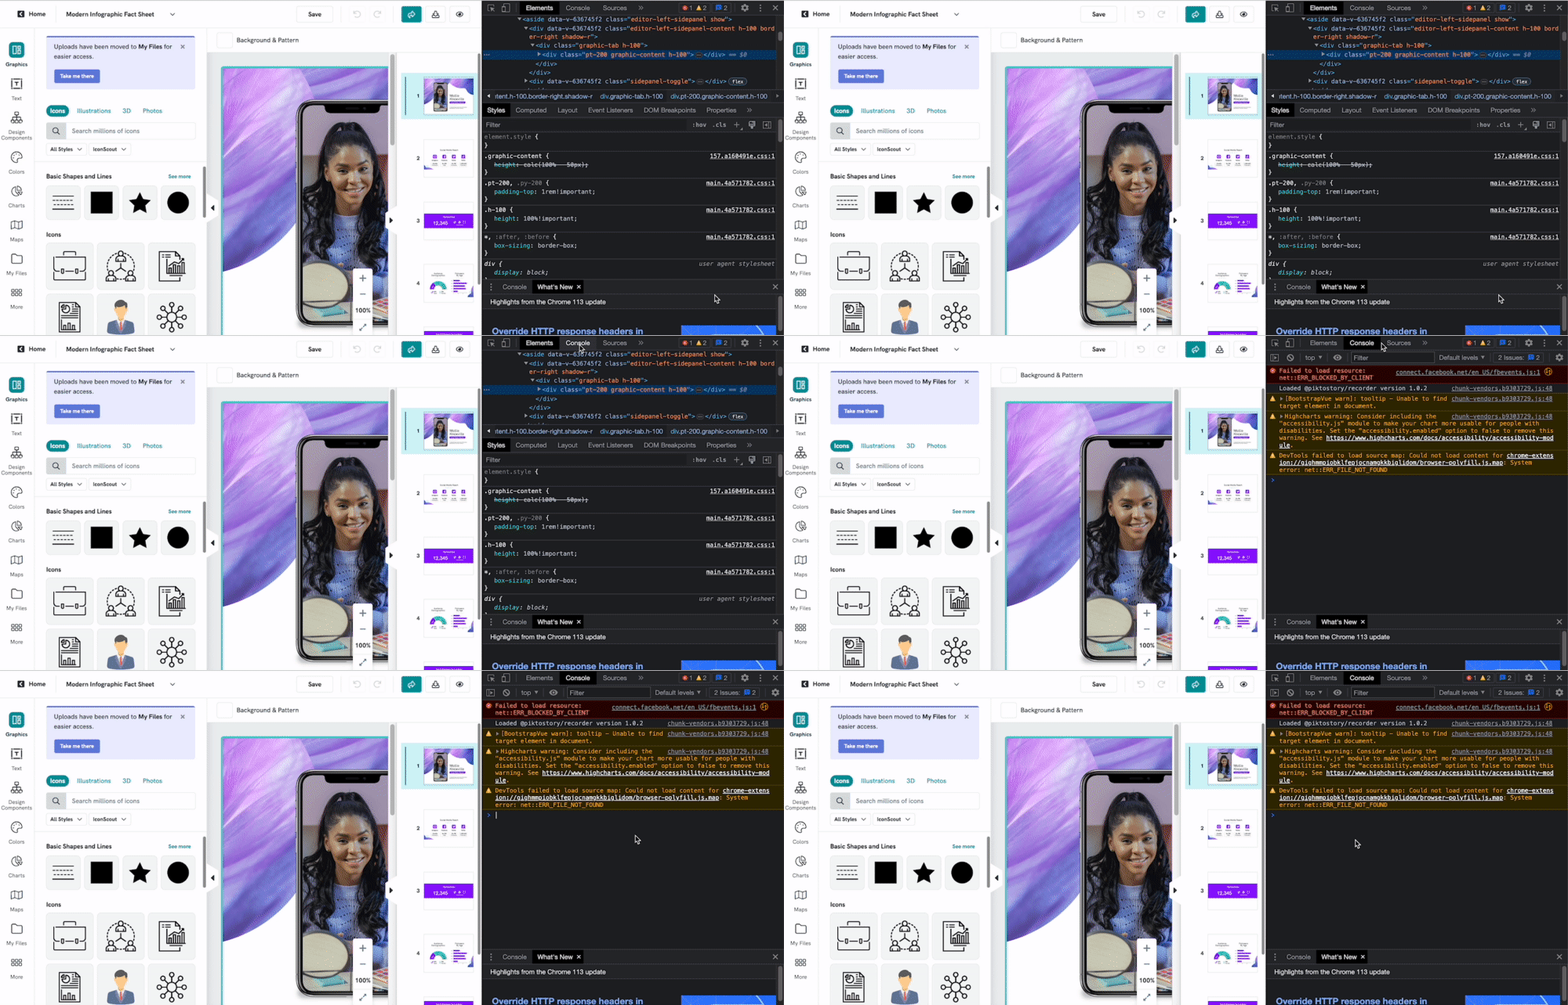
You will see several tabs at the top of the Inspector, and one of them is Console. Click on Console:
- 5
-
Finally, take a screenshot, as shown above (you will see any errors marked in red). This is the information that we need. You can now send your screenshot to our Customer Support Team.
Steps to take a screenshot for Network Tab:
- 1
-
Make sure you’re on the page that the issue is happening
- 2
-
Once you have run into the issue, right-click on the page and a window will pop up
- 3
-
Click on Inspect
- 4
-
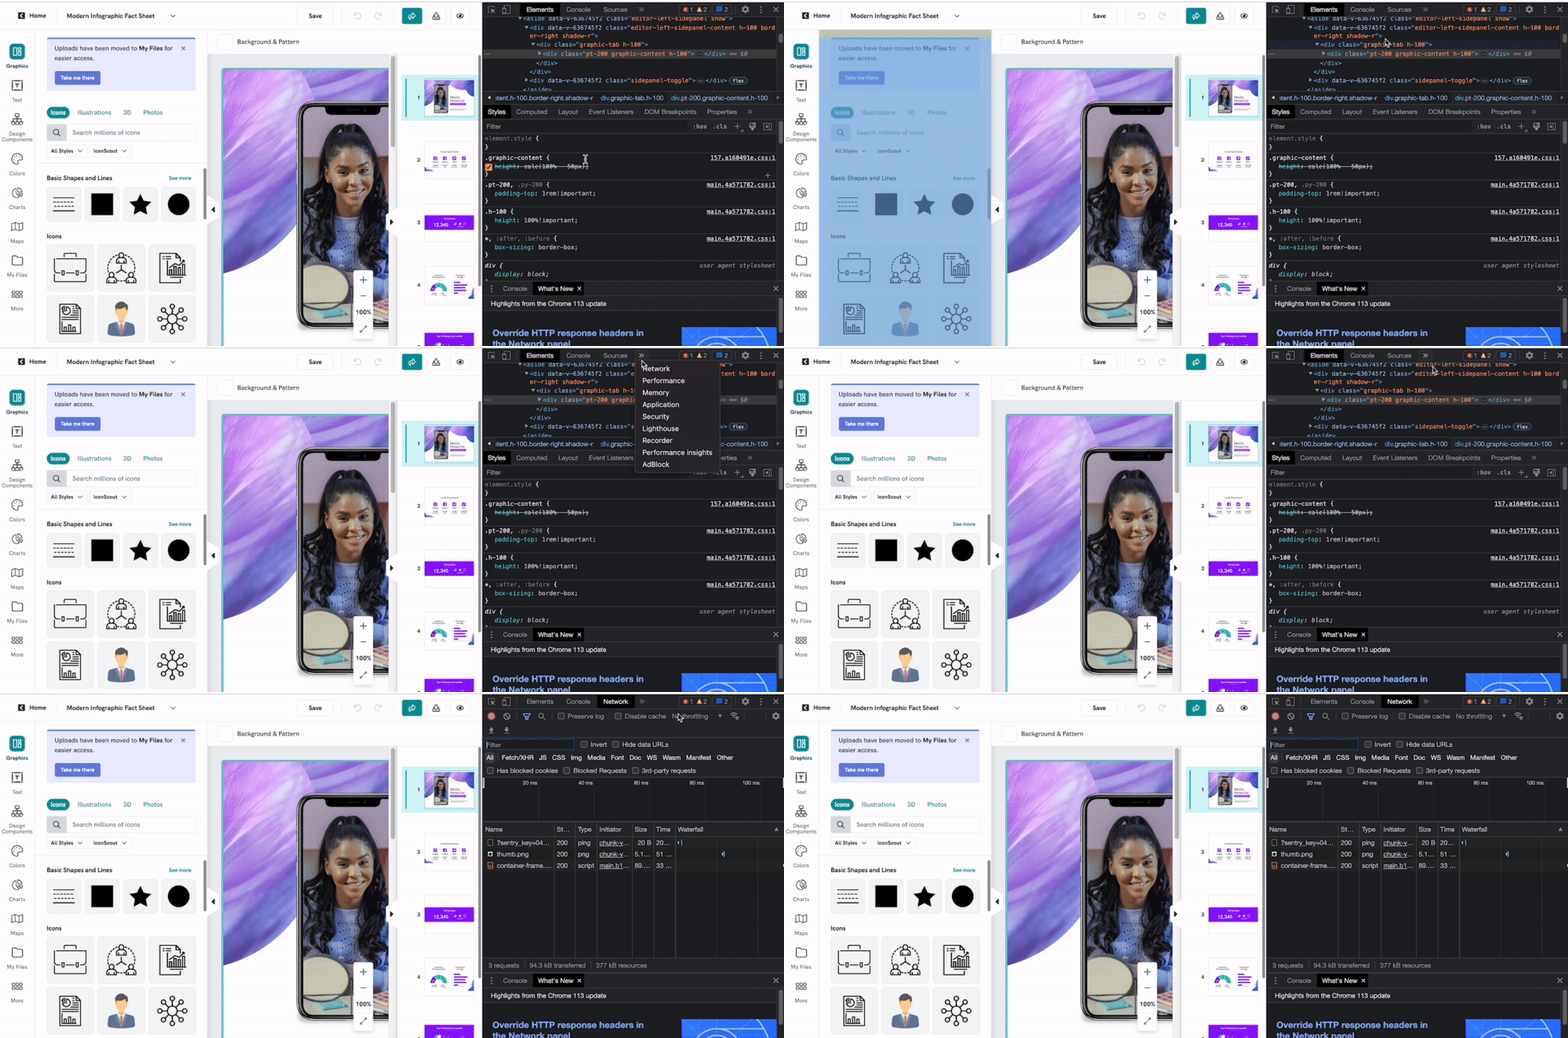
You will see several tabs at the top of the Inspector, and one of them is Network. Click on Network:
- 5
-
Refresh the page by clicking on the Refresh icon button.
- 6
-
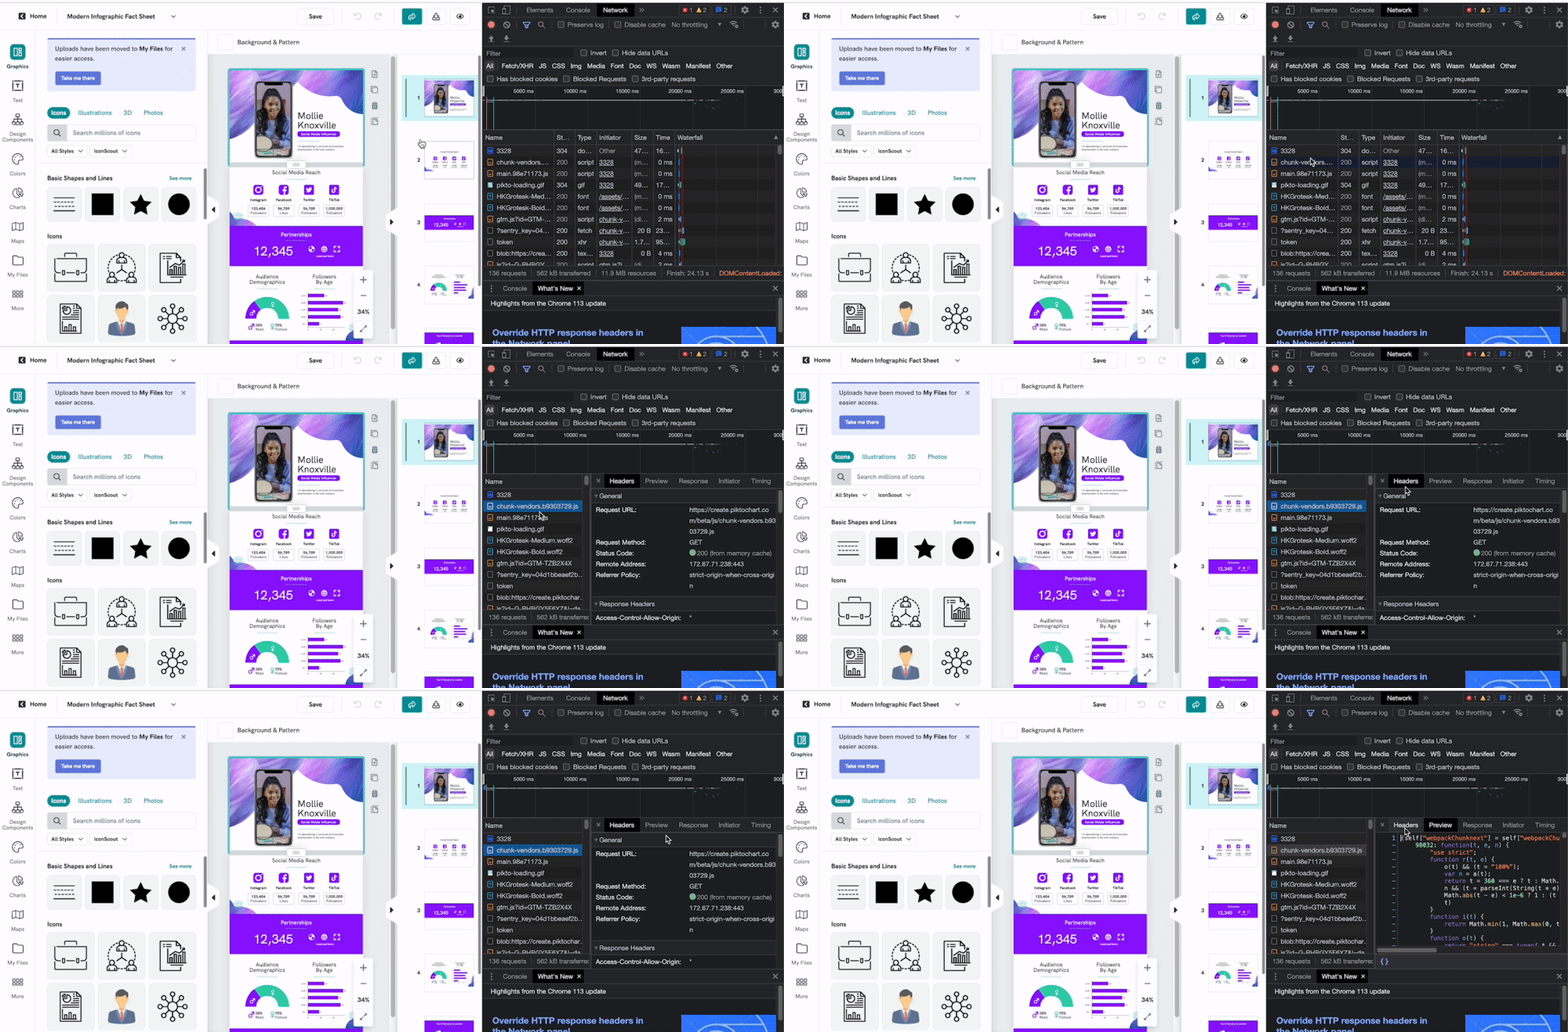
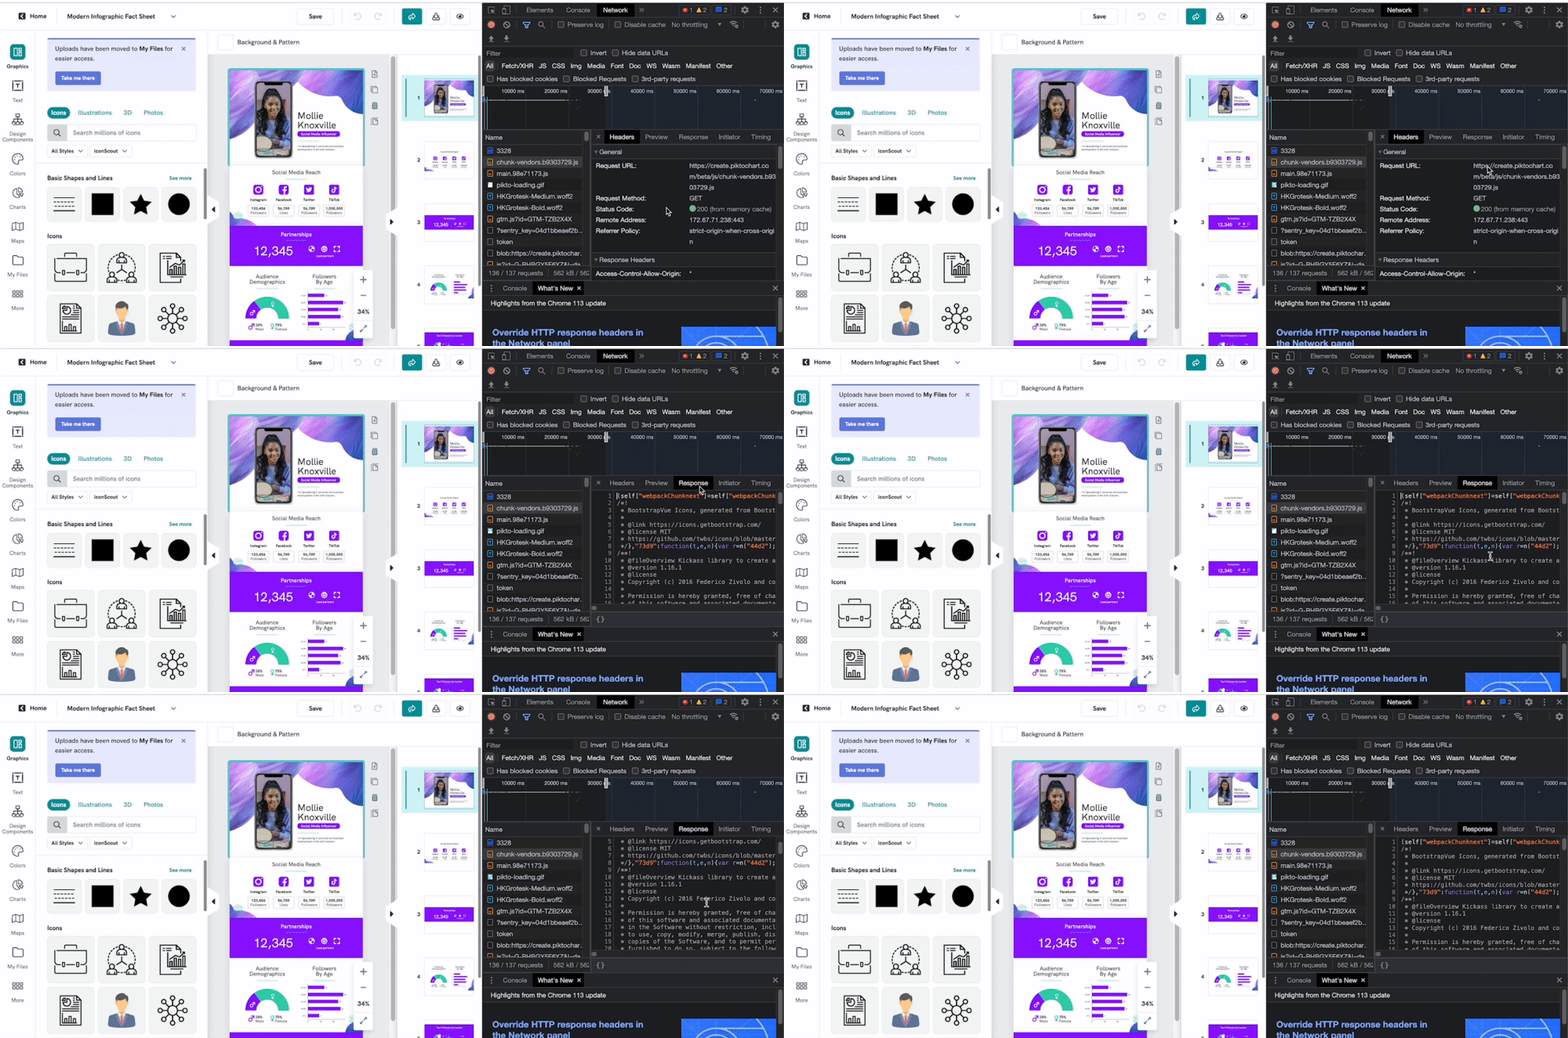
Then, click on one of the red errors (the very first error ) on the left and select Headers. Once there, take a screenshot as shown below:
- 7
-
Then, select Response and take another screenshot:
- 8
-
This is the information that we need. You can now send your screenshot to our Customer Support Team.
What is a HAR file?
A HAR file is a recorded log of all network requests made by a web browser during the demonstration of your report. This includes URLs, metadata, and request/response headers. We use this to troubleshoot & analyze your reported experience to better understand what is causing it – pinpointing the cause of the experience, which allows our developers to gain insight and assist accordingly.
How to collect HAR file?
When collecting this HAR file, please follow these steps:
- 1
-
Make sure you are logged into Piktochart and & navigate to the window or the page where the issue is happening.
- 2
-
Open your Google Chrome browser menu with the 3 -dotted menu button in the upper right corner of your browser window.
- 3
-
Then click More Tools > Developer Tools.
- 4
-
From the panel opened, select the Network tab
- 5
-
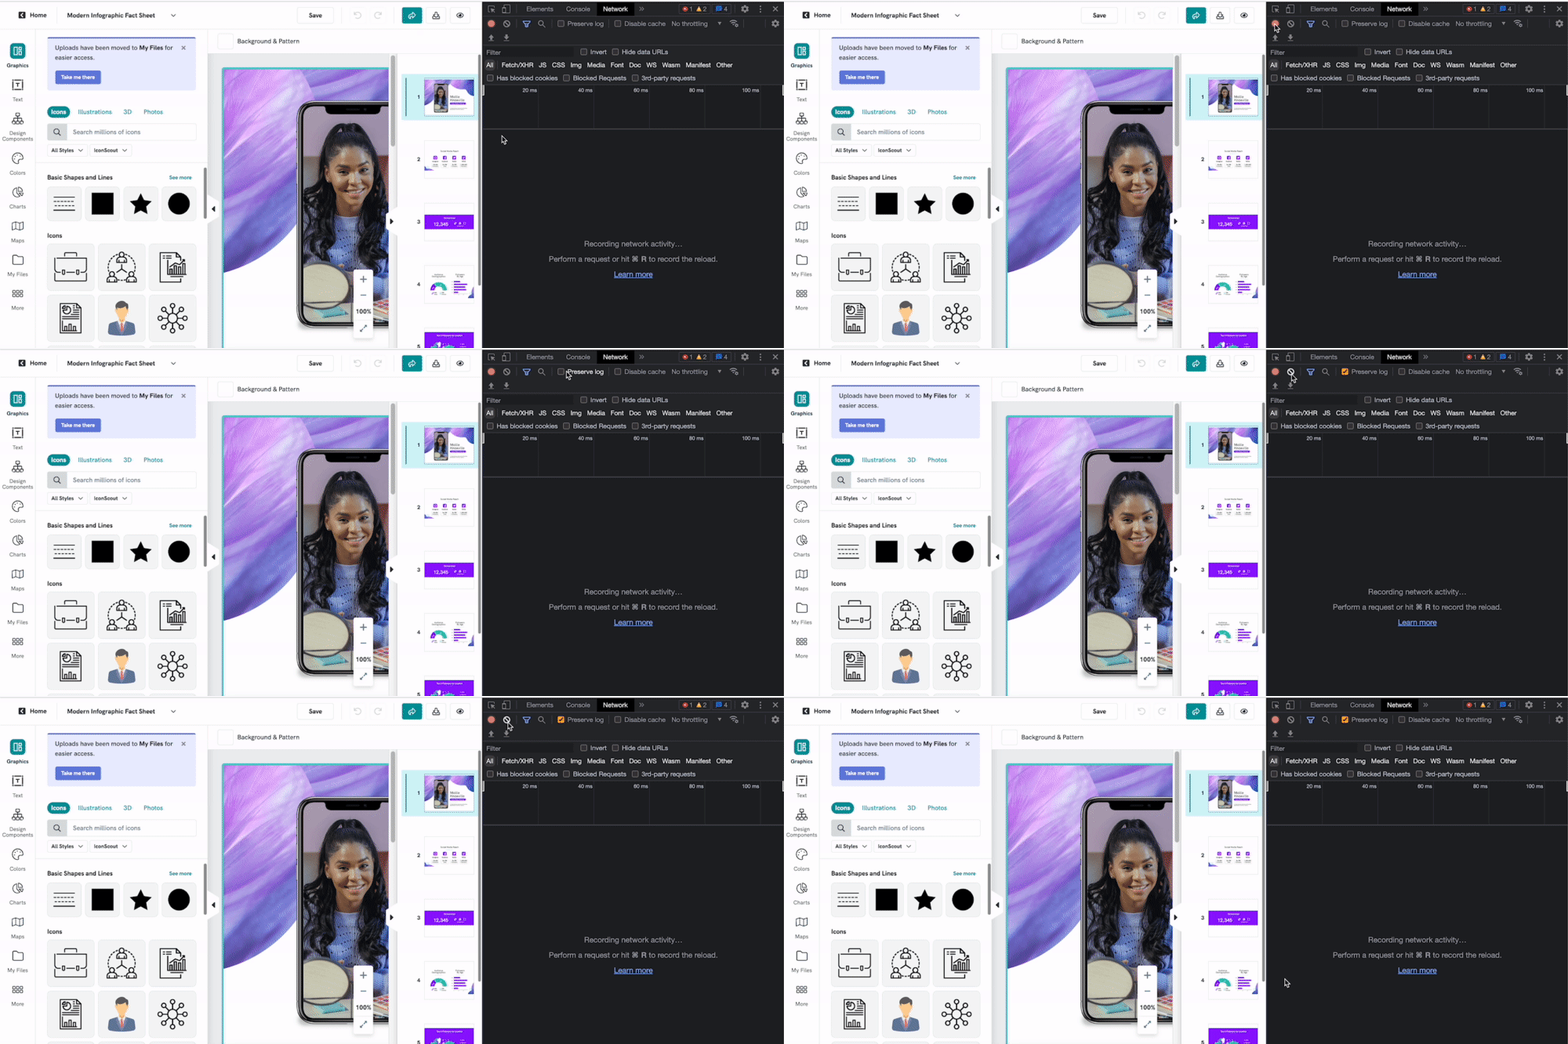
Check the box Preserve log
- 6
- Click the Clear button (🚫) to clear out any existing logs from the Network tab
- 7
-
Look for a round record button (🛑) in the upper left corner of the tab and make sure it is red. If it is grey, click it once to start recording
- 8
-
Reproduce the issue that you were experiencing before. The Network tab will record your web data into a HAR file.
- 9
-
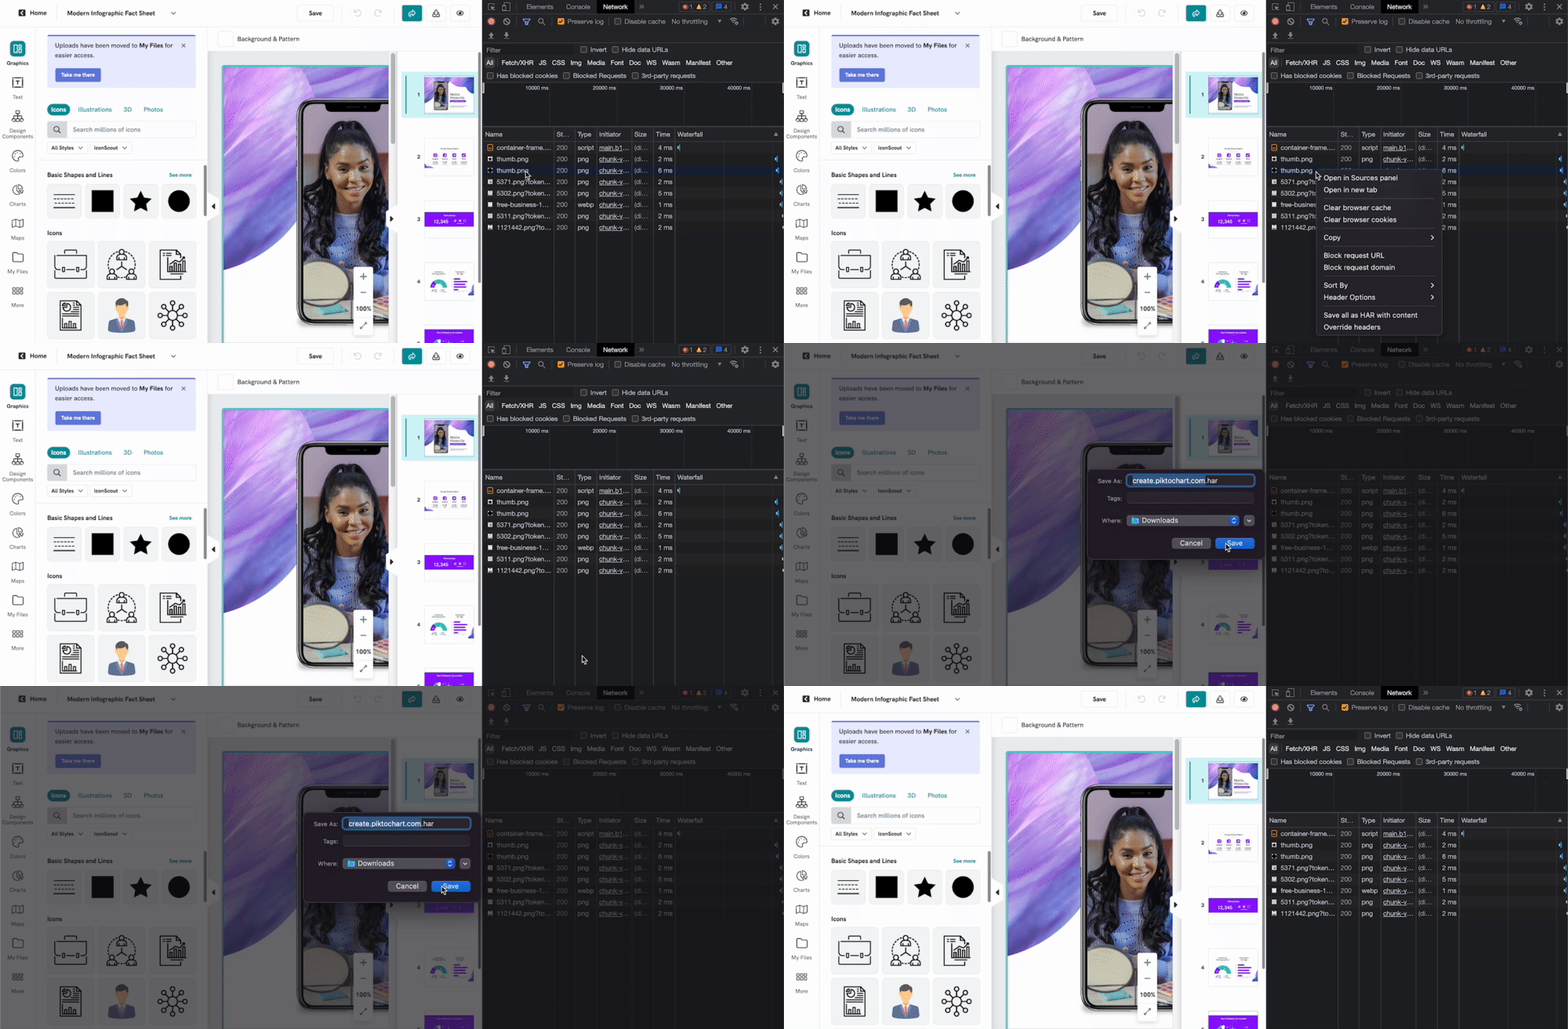
Once you have reproduced the issue, right-click on the grid of network requests, select Save as HAR with Content, and save the file to your computer
- 10
-
Finally, upload your HAR file and attach it to your email so that our Support team can analyze it.
Common Questions
When do we request for a screenshot of the console, network tab or a HAR file?
We usually request a screenshot of the console and network tab when there is a specific loading issue e.g. icons or photos not loading. As for the HAR file, we request this when there is no issue with internet connection on your end but the Piktochart page is still loading extremely slow for you.
