Dashboard for Piktochart Visual
The dashboard houses all your work. From here, you may view and manage all your saved visuals and choose the format you'd like to use.
Here is an overview of all the Pikto AI templates to help you create your visuals in seconds:


If you prefer to stick to manual templates, you find them here:

If you need to switch to different workspaces, go here:

All your created visuals will be found here:
To help you keep control of everything, we have also added the following features:
- Folders. Click 'Add Folder' to create new folder and if you click on each folder, you see which visuals it contains

- Search bar for projects. Title similar visuals with a common word or numeral, so they show up together when you search.

-
Sort option. View your visuals based on when they were last modified or alphabetically.
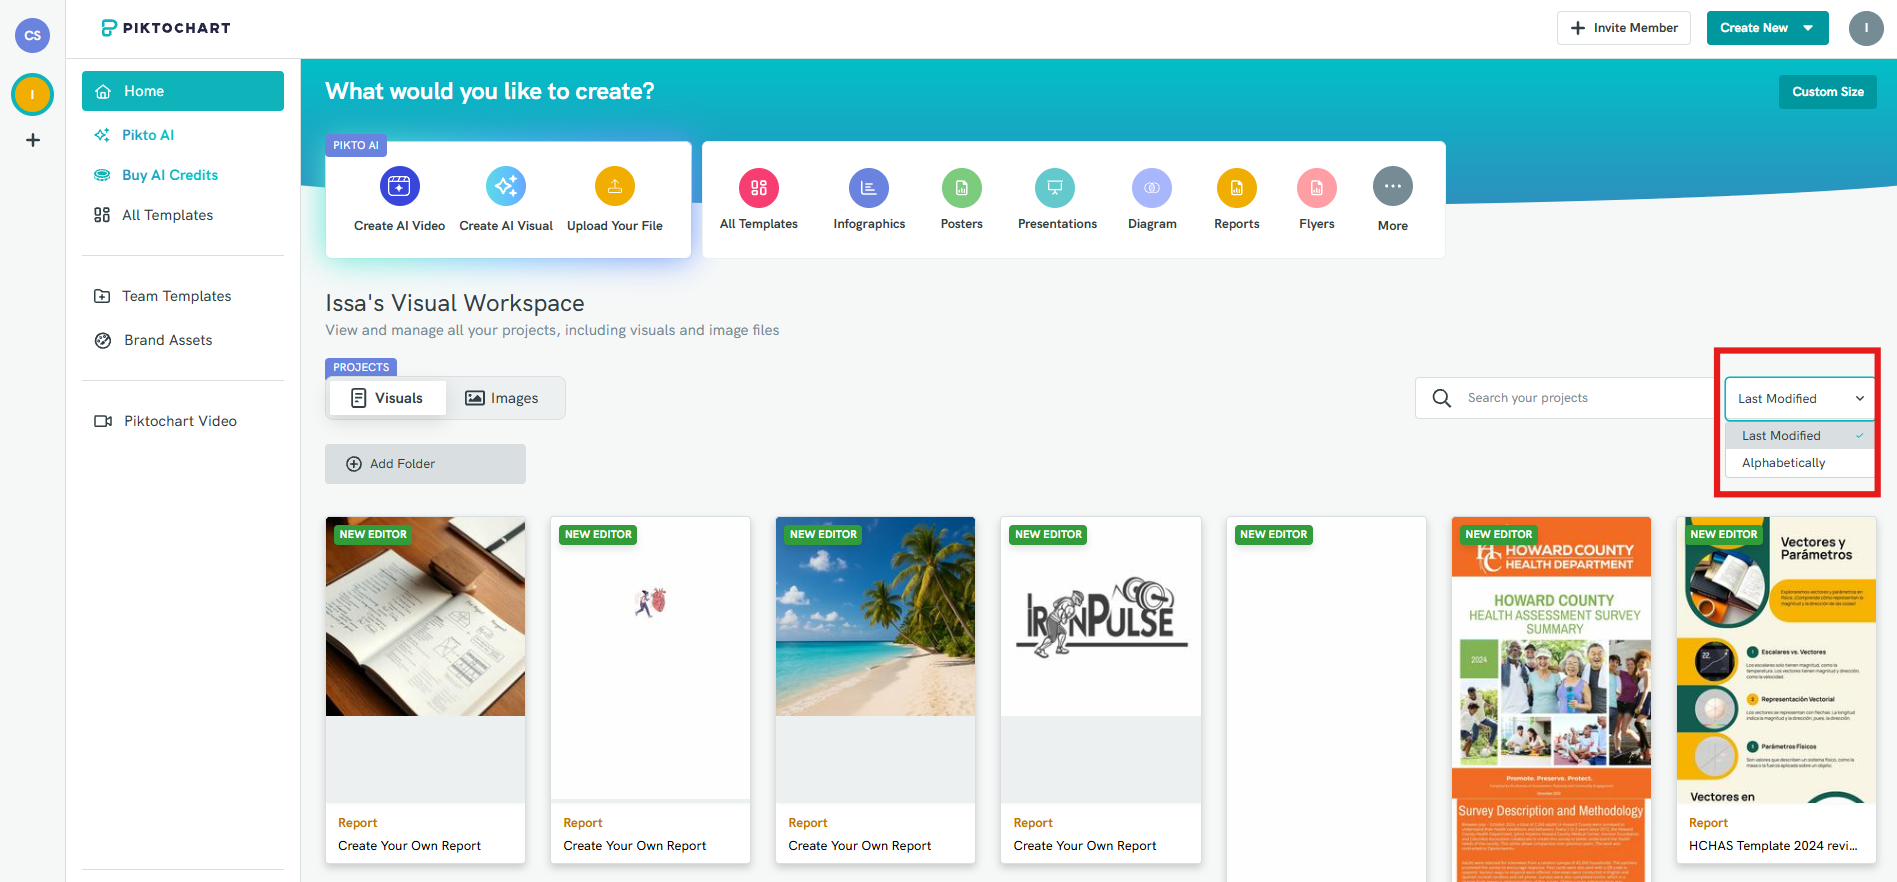
- Toggle between Visuals and Images. Easily toggle between visuals and images to sort your content and quickly find exactly what you’re looking for, whether that’s images or visuals only.


Common Questions
Why Can’t I Find My Saved or Generated Visual?
If your visual seems to be missing, here are a few things to check:
- Dashboard: All saved and generated visuals are stored on your Dashboard by default.
- Login email: You might be logged into a different account than the one used to create the visual. Try logging out and back in with the correct email.
- Folders: If you’ve organized your visuals before, it might be saved in a specific folder on your Dashboard.
If you signed up for a free access, it’s also possible that your 7-day access has ended. Once the trial expires, your visuals will no longer be accessible and are removed from your account.
Still can’t find it? Feel free to reach out to our support team!
Why are my visuals deleted?
Your visuals are restricted or deleted because your 7-day free access or grace period has ended, and your account no longer has an active subscription. Learn more about this here: Free Account Access Limit.
To unlock full access and restore publishing, you’ll need to subscribe to a paid plan.
What files are included under Projects?
Projects includes all editable files on your dashboard, such as Visuals (PiktoNext) and Images (Image Editor).