Adding Icons, Illustrations and Lines
Icons are SVGs (Scalable Vector Graphics). This means that icons do not lose their resolution even when they have been resized.
If you are a PRO or Business Plan user, you will have full access to our Iconscout integration library, giving you even more icons and graphics to choose from! Free accounts can still enjoy Piktochart’s icons library and get a preview of the icons in the IconScout library.
Adding Icons
- 1
- Create or open an existing design.
- 2
-
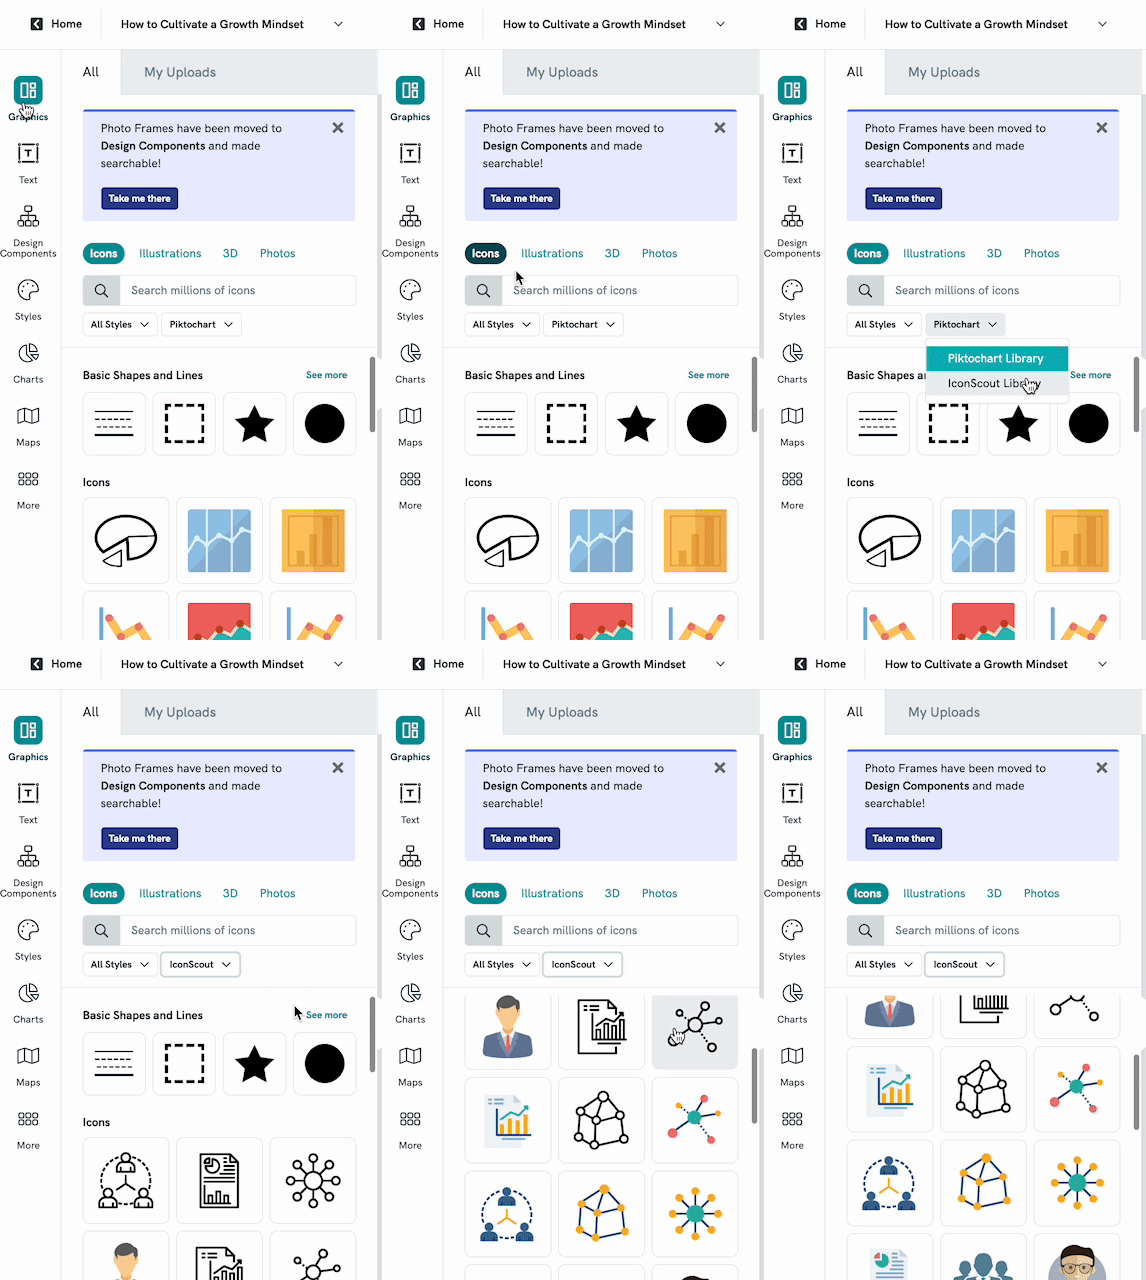
In the Editor, click the Graphics > Icons tab on the left panel.
- 3
-
In the dropdown, select either from Iconscout Library or Piktochart default icons library.
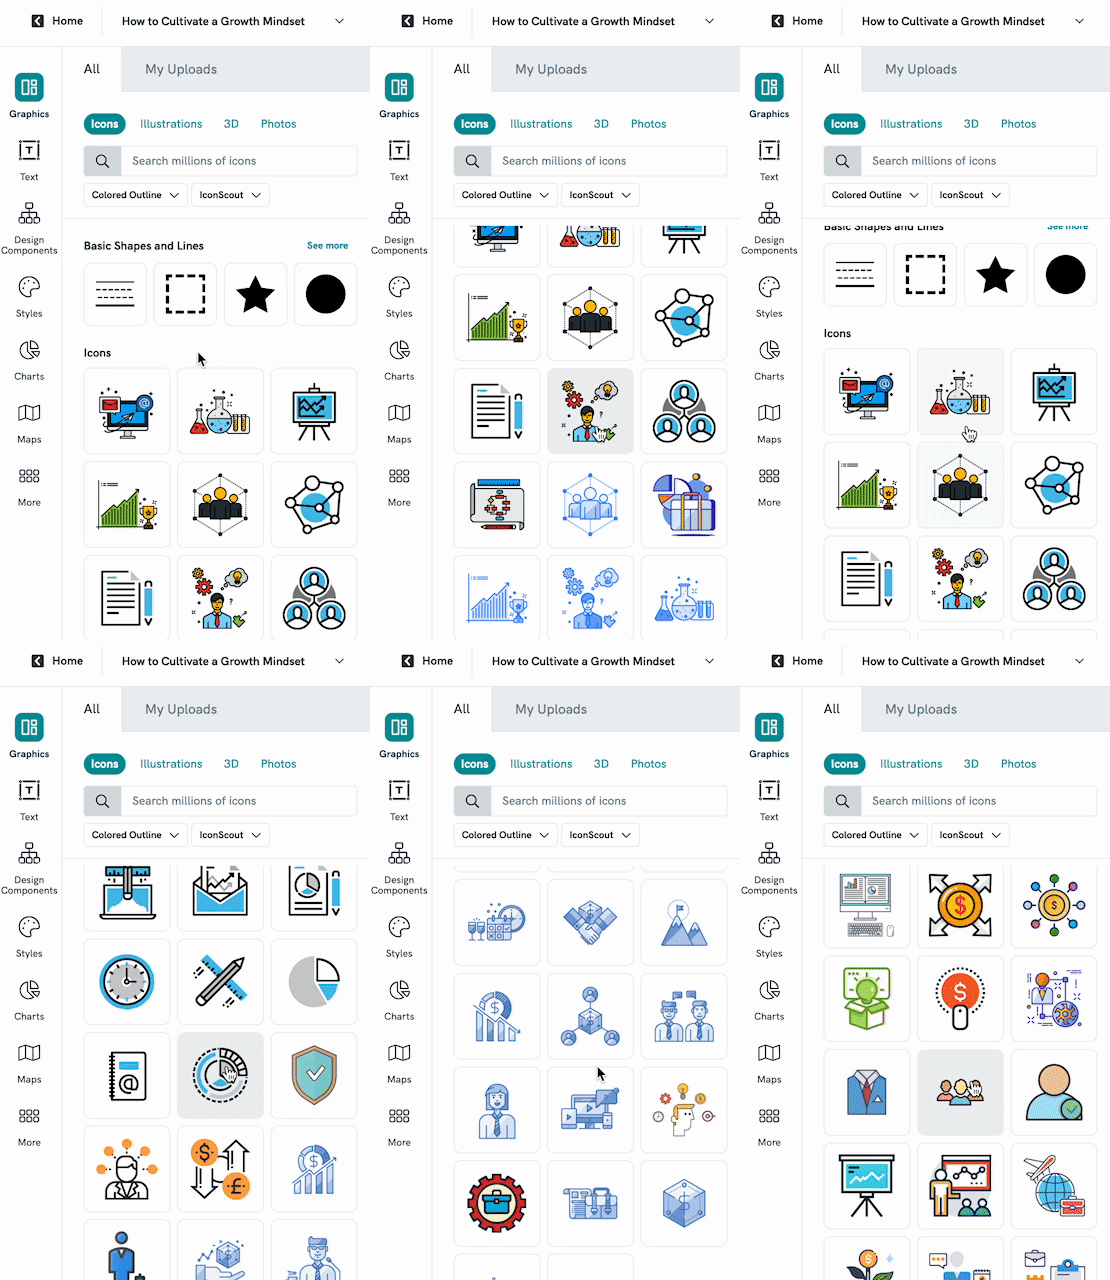
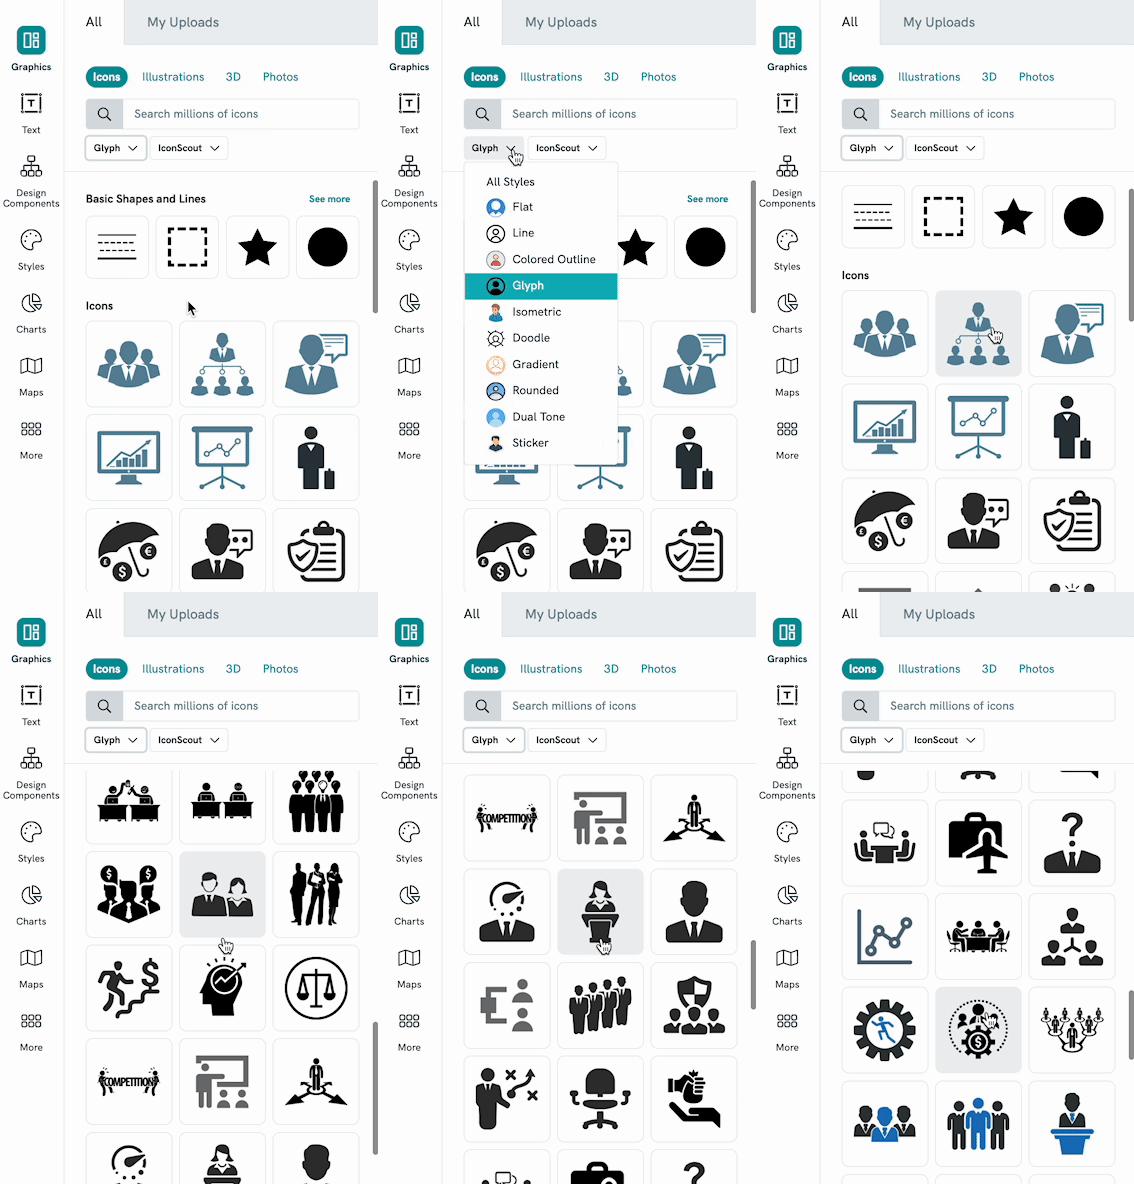
To help you to search further, you can also filter based on the styles of the icons, for example, a flat icon, a doodle icon, or a sticker icon.

- 4
-
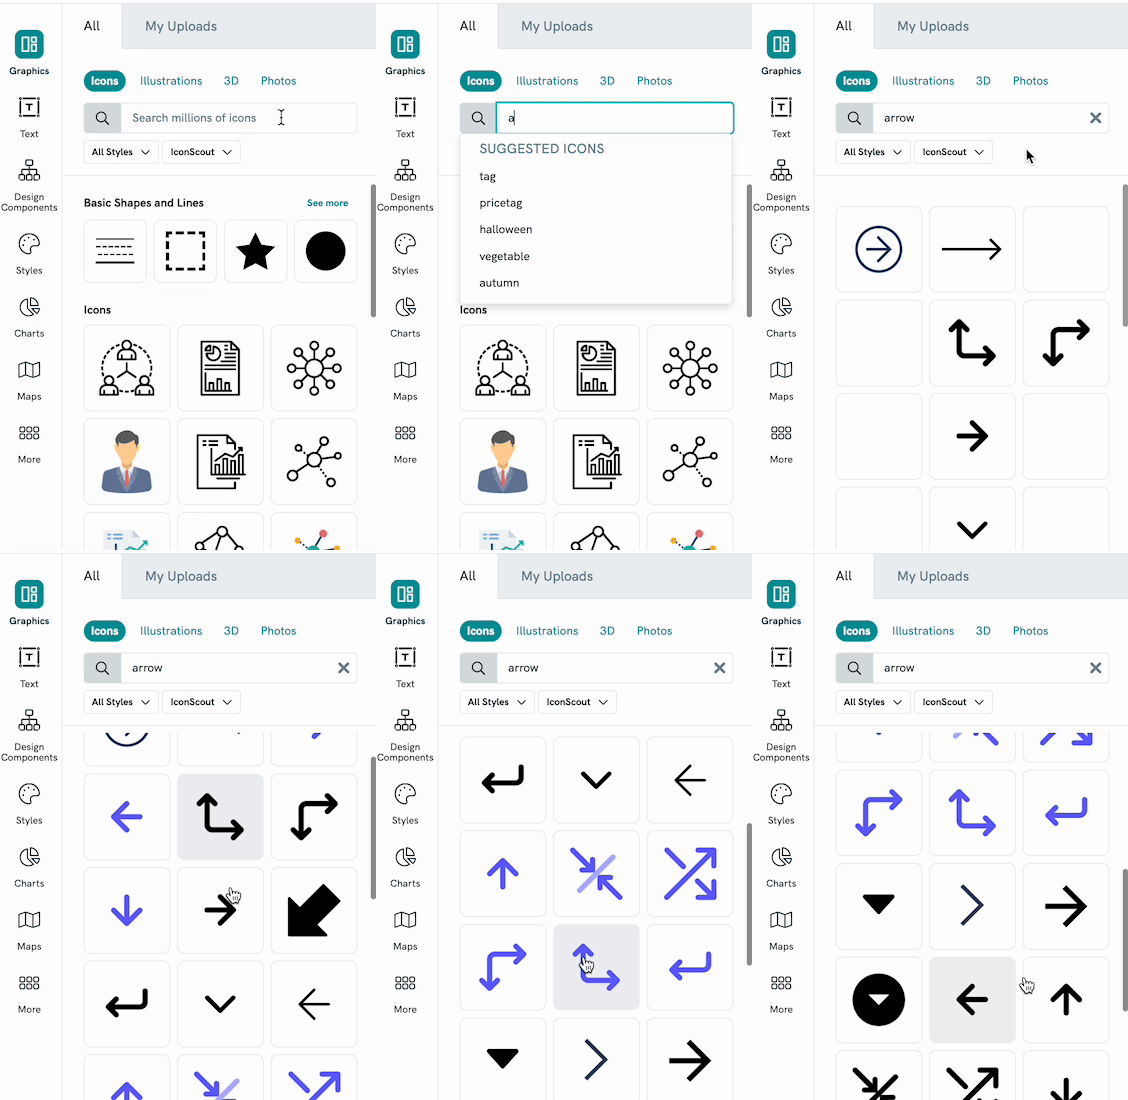
Using the Search bar, enter specific keywords to look for specific icons/elements. Or, select See More under the respective categories.
- 5
-
Browse and click to select the specific icon to add to your visual.
- 6
-
Under the Icons tab, you can also add Basic Shapes and Lines.
-
Single-colored and Colored Icons
There are two types of icons in our libraries defined by how they are colored:
- Colored icons contain more than one color, texture, or gradient. With these icons, it is not possible to change or edit their colors.
- Single-colored icons contain just one color. You are able to change the color of these icons using the color tile option in the upper toolbar.
Changing colors of single-colored icons
- 1
-
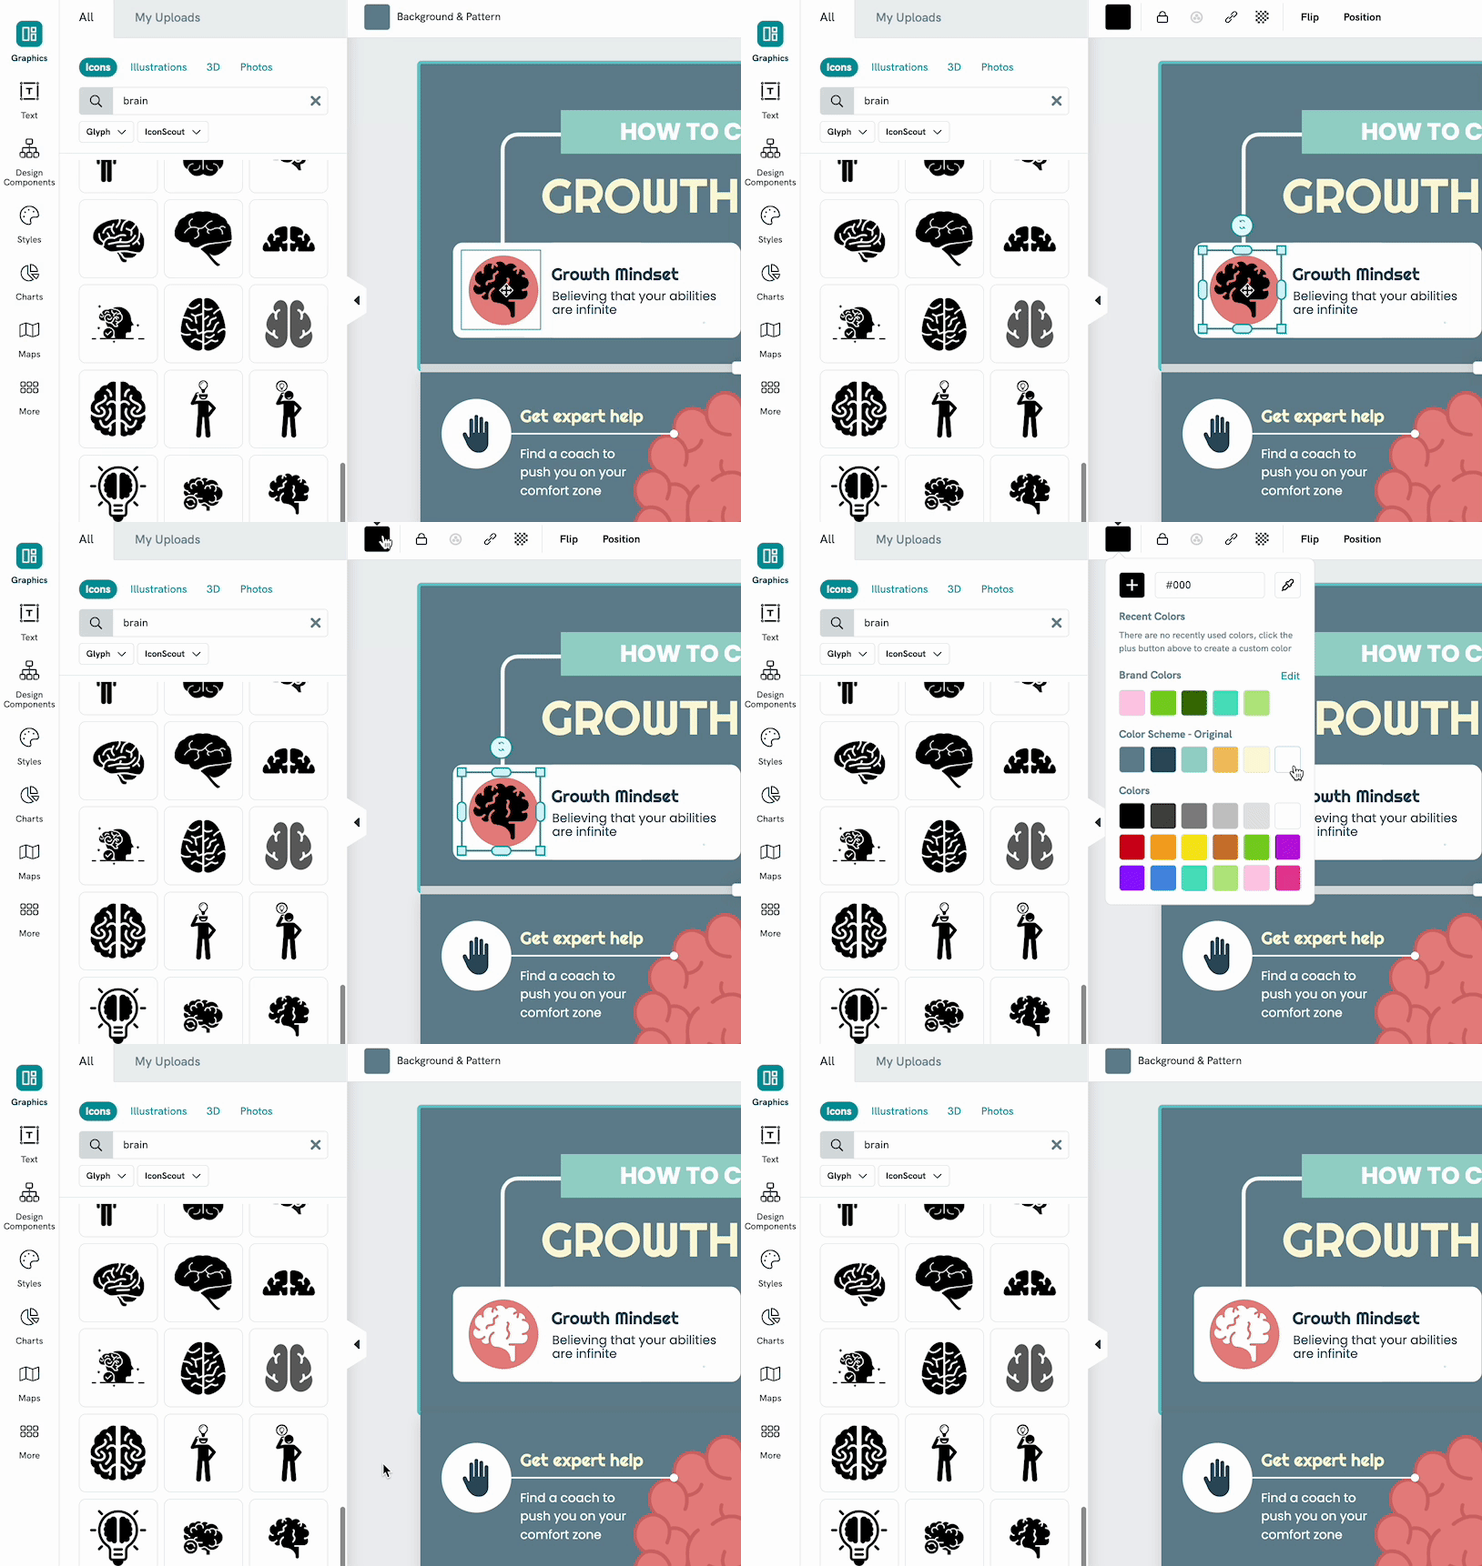
Select the specific icon to add to your visual.
- 2
-
Click on the square color tile accessible in the top panel to select the color options.
- 3
-
Change the color of the graphic element by choosing a default recent color or clicking the '+' sign to choose from a color palette. You can also insert a # HEX color code in the column.
Adding Illustrations
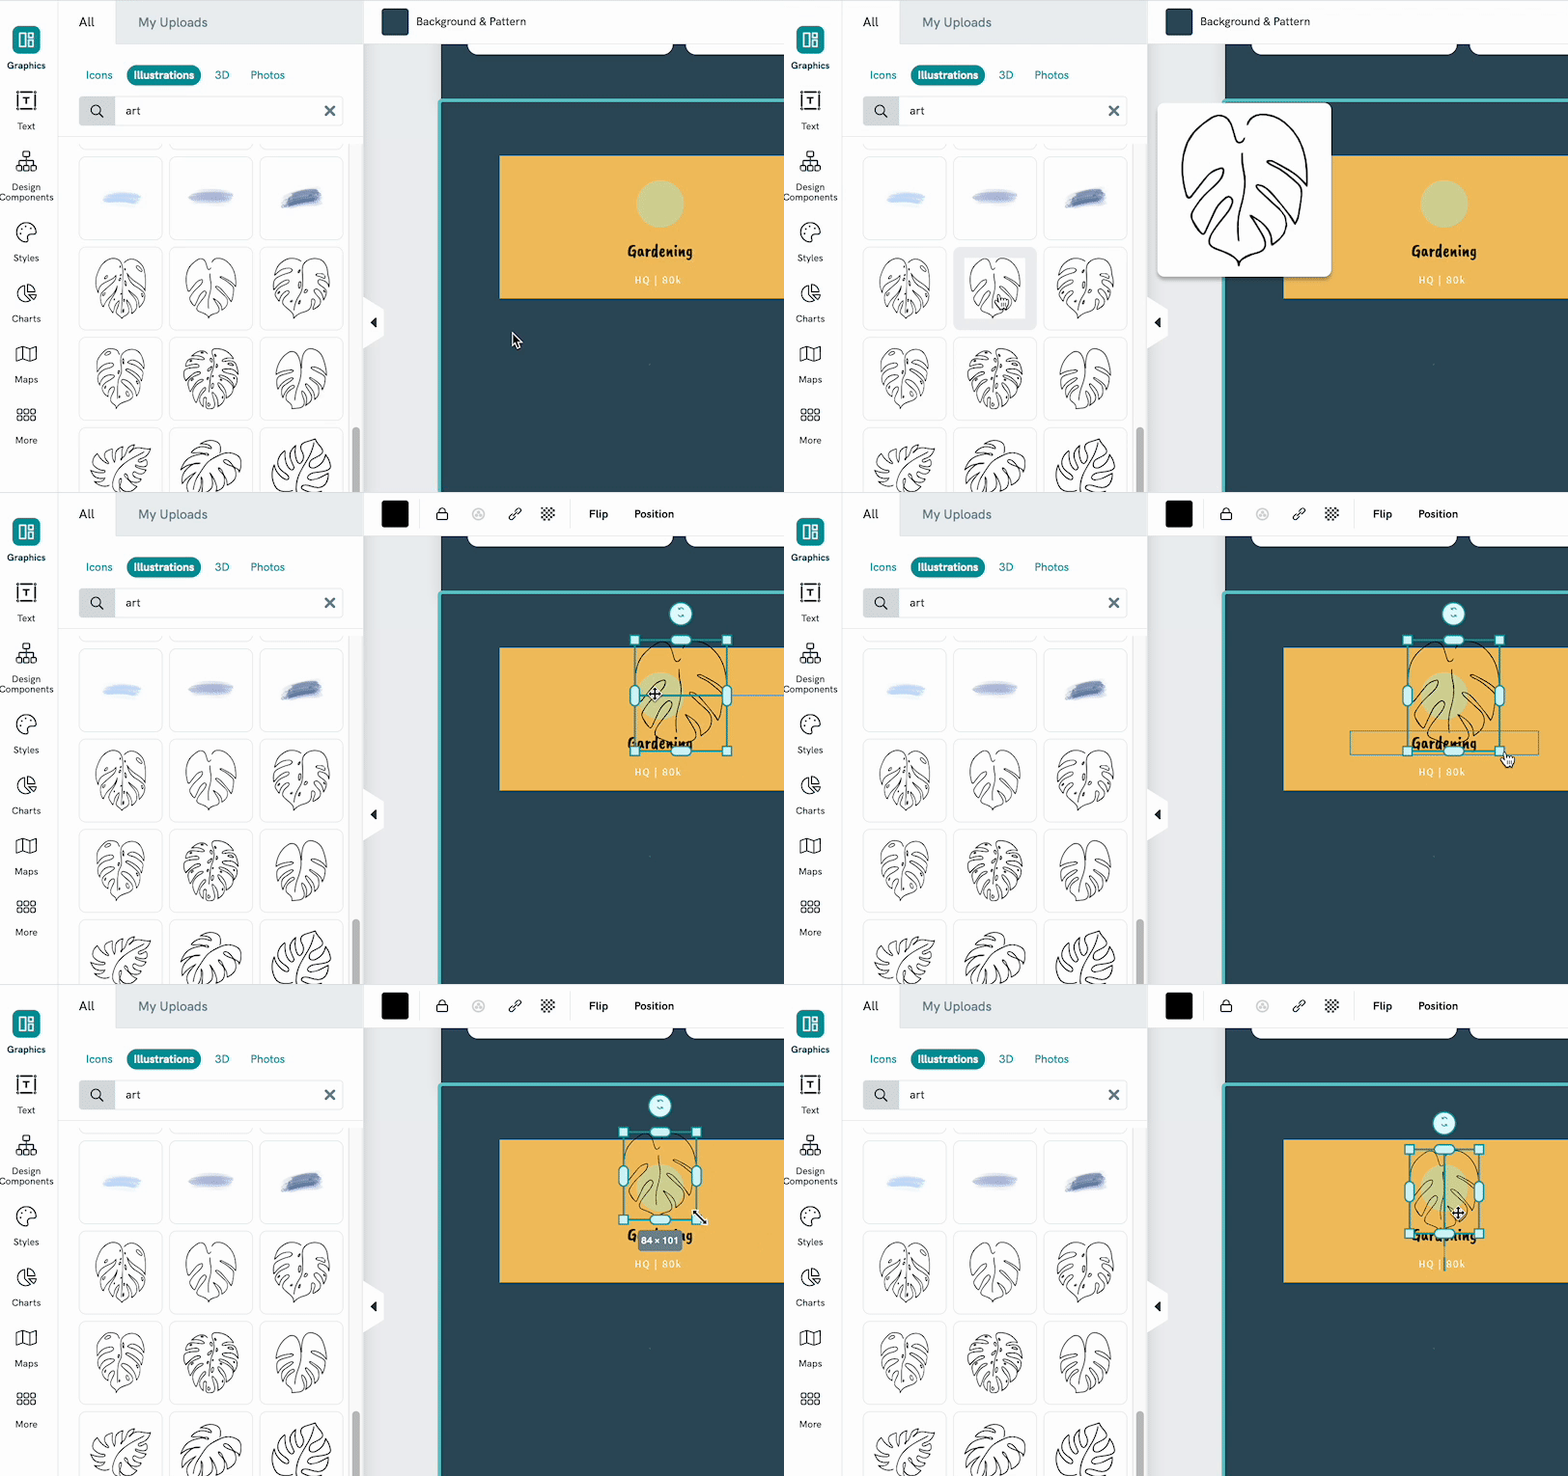
In the Editor, click the Graphics > Illustration tab on the left panel.
Browse and click to select the specific illustration to add to your visual. You can also search for specific illustrations using keywords in the search bar.
Additionally, you can search for a specific illustration by entering a keyword in the Illustrations search bar. You will then be able to find all the results available for you!

Adding Lines and Basic Shapes
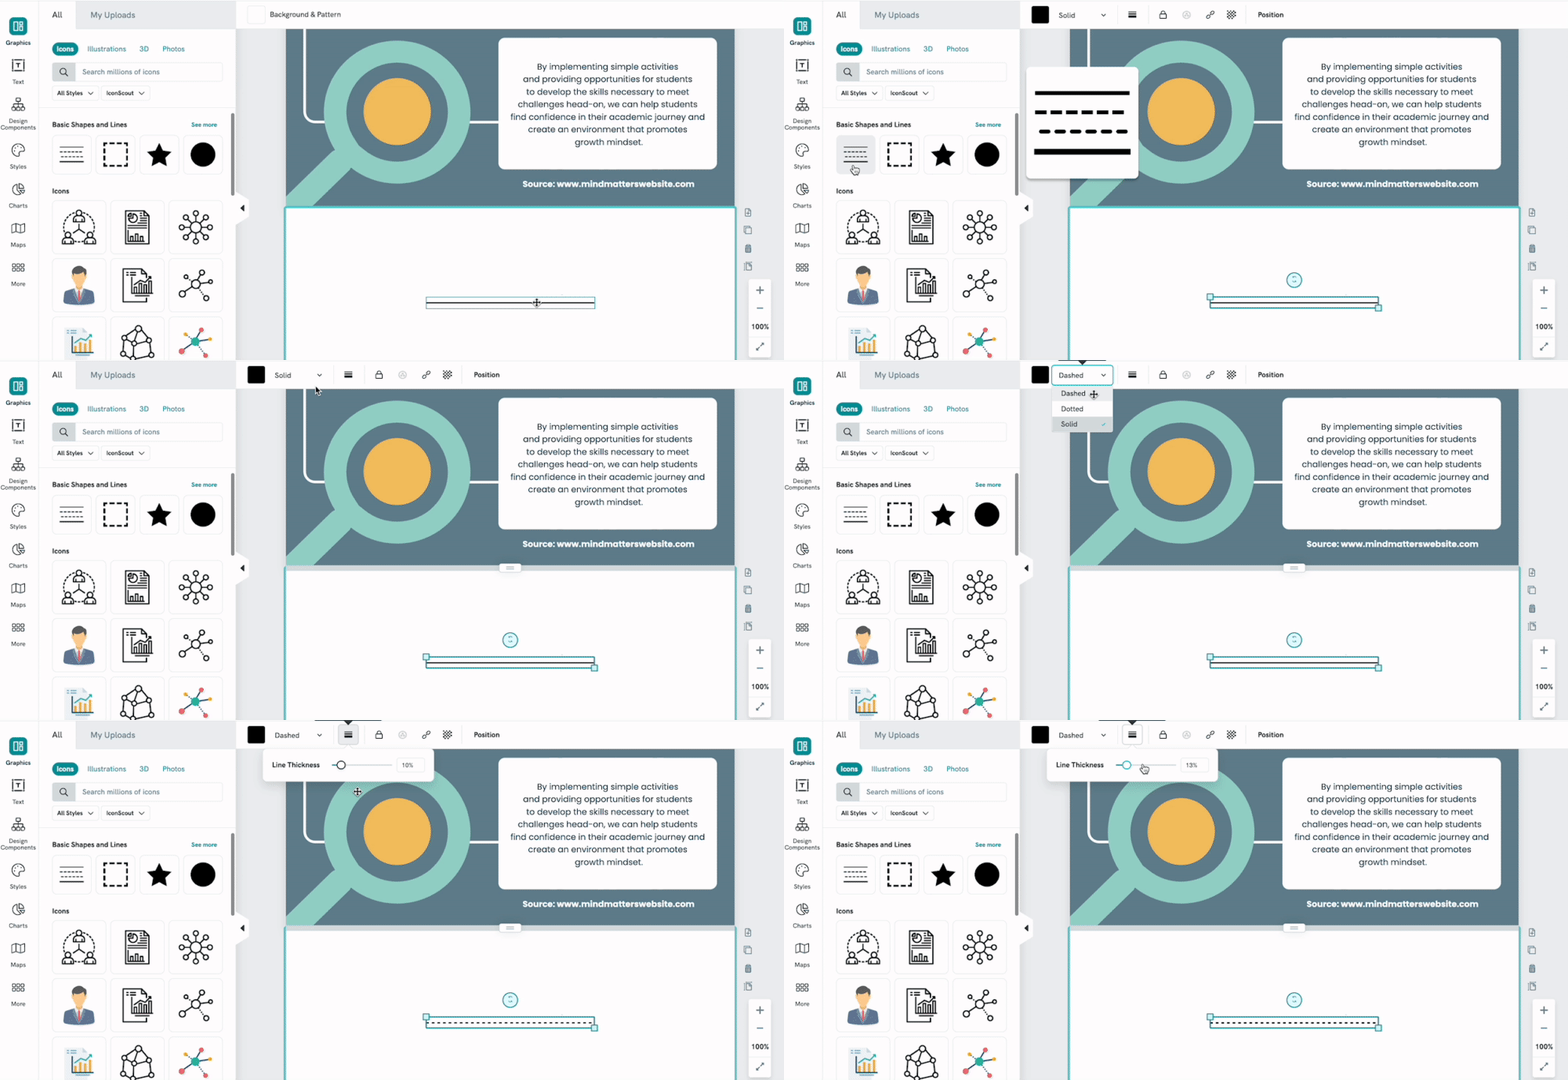
You may find the option to add and customize lines under the Icons library. Here's how you can add shapes and lines to your visual:
- 1
-
Click on the Icons tab library.
-

-
- 2
-
Select the Line or Shape you want and place it in your project by simply clicking on it or dragging and dropping it into place.
-
- 3
-
The Line settings panel will show up on the top panel. You will be able to adjust the line style, color, and thickness.
Common Questions
How do I add arrows to my visual?
Easily search using the keyword: Arrow from the Search bar in the Icons tab. The search result will show a wide variety of options to choose from!
How do I cite or give proper attributes for the use of icons?
There is no need to cite/attribute the icons used in your visual since our icons can be freely used without the need to explicitly cite Piktochart as the source. Read more about using Piktochart commercially here.
Can I add my own icons or graphics?
For sure! You can upload your own icon and add them to your visual! Learn about how you can upload your own icon here.
