How to Import Data to Your Charts
There are 3 different ways in which you can import data for your charts!
IN THIS ARTICLE
Enter Data Manually
This is best if you have small data to work with.
To do this, input your data manually into the spreadsheet table on the right of the chart window. The changes will be reflected immediately on your chart within your canvas.

To remove or add a column or a row, right-click the specific column or row for a dropdown option to appear.

Import From File
If you have an excel spreadsheet in XLS, XLSX, or CSV format, you can import your data files from your computer to the Piktochart editor.
Under the Data tab, click Upload File.
A window will appear for you to select your file to open. Select File to Open.
If your Excel file (.XLS and .XLSX) is detected to contain more than one sheet, you will be asked to select the correct sheet from which to pull the data for your chart. Select the specific sheet and click Upload.
Your data contained in these files need to have column and row headers, and at least one column of data.

Import From Google Sheets
To import your file from a Google Sheets,
Under the Data tab of your Charts editor, click Google Sheets. You will be requested to Paste your Google Sheet URL link.
On your Google Sheet, click the Share button.
Change restriction to allow Anyone with Link.
Copy the link and click Done to confirm the action.

Paste the link into the text bar in the chart tab. Click Link Data.

Your data will be reflected on your Chart immediately.
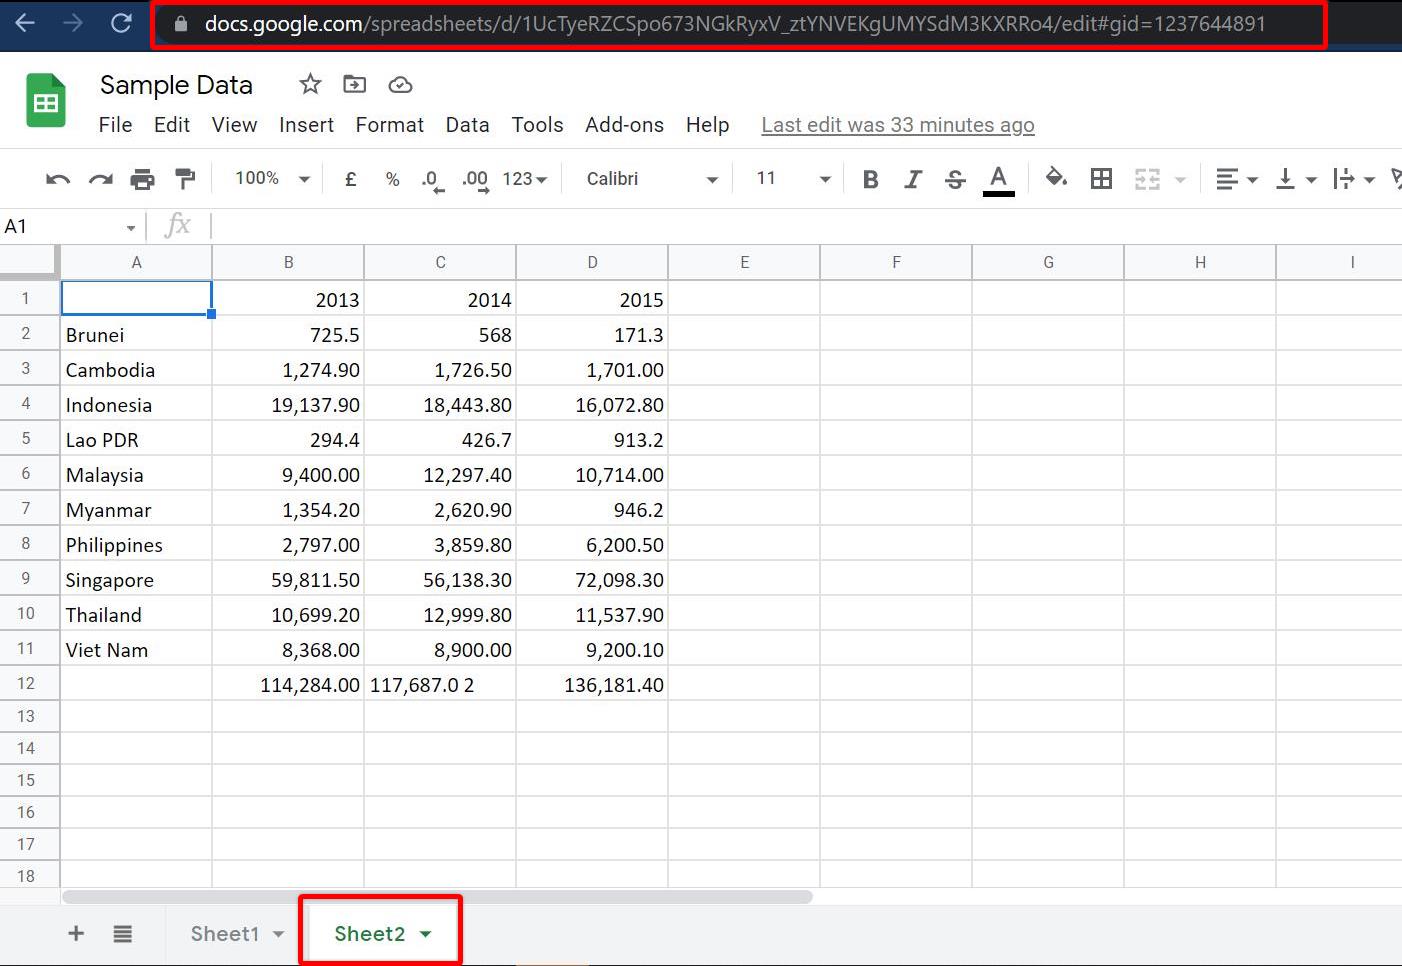
If you would like to link a specific tab, open the tab and copy the selected tab browser URL instead. Like so:
Common Questions
What happens if I update the data on Google Sheets?
Your data will not automatically be updated. Should there be any changes to your data, you will need to open the Piktochart Editor, unlink the chart and link your updated chart again following the steps under Import from Google Sheets and ensure that you have successfully Save your visual.
- If your visual is published on the web via https://create.piktochart.com/output/... , the data will be updated when you refresh the page.
- If you download your visual as an image or PDF, you'll need to open the Piktochart editor and download a new copy of the visual.
How do I modify my data after importing it to Google Sheets?
When your data is imported from the Google Sheets, you may only modify the data on the Google Sheets alone. It is not possible to modify the data on Piktochart. This is to maintain consistency so the data is always available in one place.