Piktochart New Editor
We’re excited to announce that Piktochart is moving to a new and improved editor — designed to make your visual creation smoother, faster, and more powerful than ever.
Our new editor brings you a modern design experience with exciting new capabilities, including:
- AI Image Generation – Create the perfect visuals instantly with built-in AI.
- Enhanced Charts & Tables – Enjoy a more intuitive, flexible, and accurate data visualization experience.
- Smoother Editing Workflow – Edit, arrange, and style elements effortlessly with improved layout and precision tools.
This upgrade is part of our ongoing effort to give you a more unified and productive creation experience across all visual formats — from infographics and reports to videos and presentations.
What You Need to Know
If you’re still working on visuals in the Classic Editor, you’ll soon be prompted to convert them to the New Editor by default.
Once converted, your visuals will adopt the new editing interface — and you’ll gain access to all the enhanced features mentioned.
⚠️ Please note: after conversion, visuals cannot be reverted to the Classic Editor.

Image Cropping
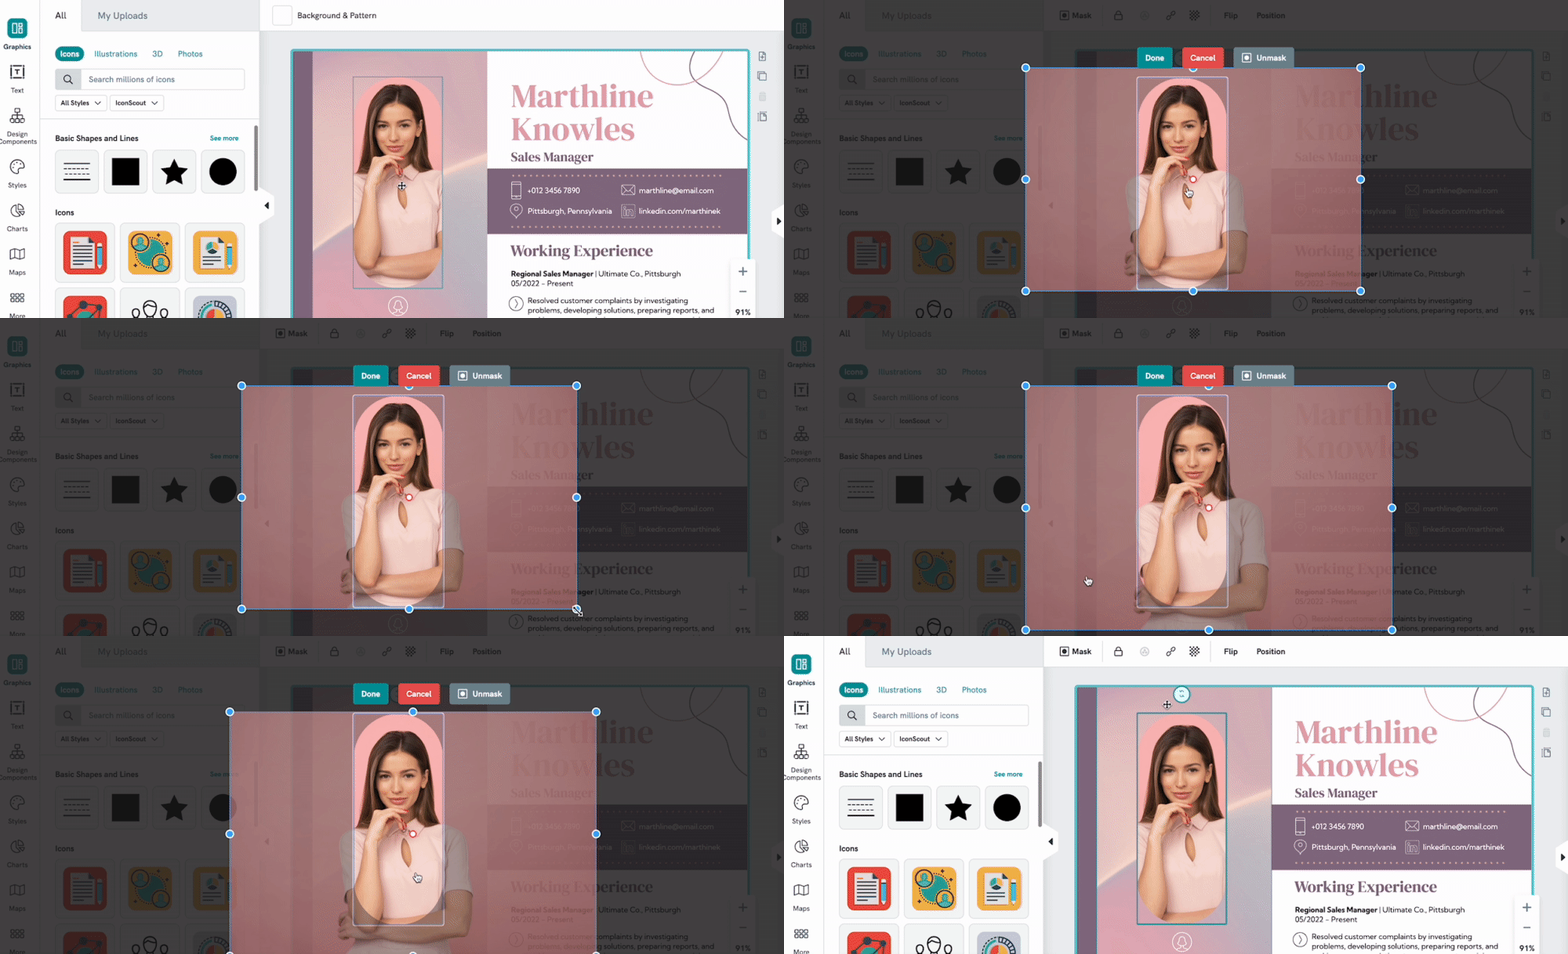
To learn how to crop your image using our masking tool, follow the steps here.
Color Dropper Tool
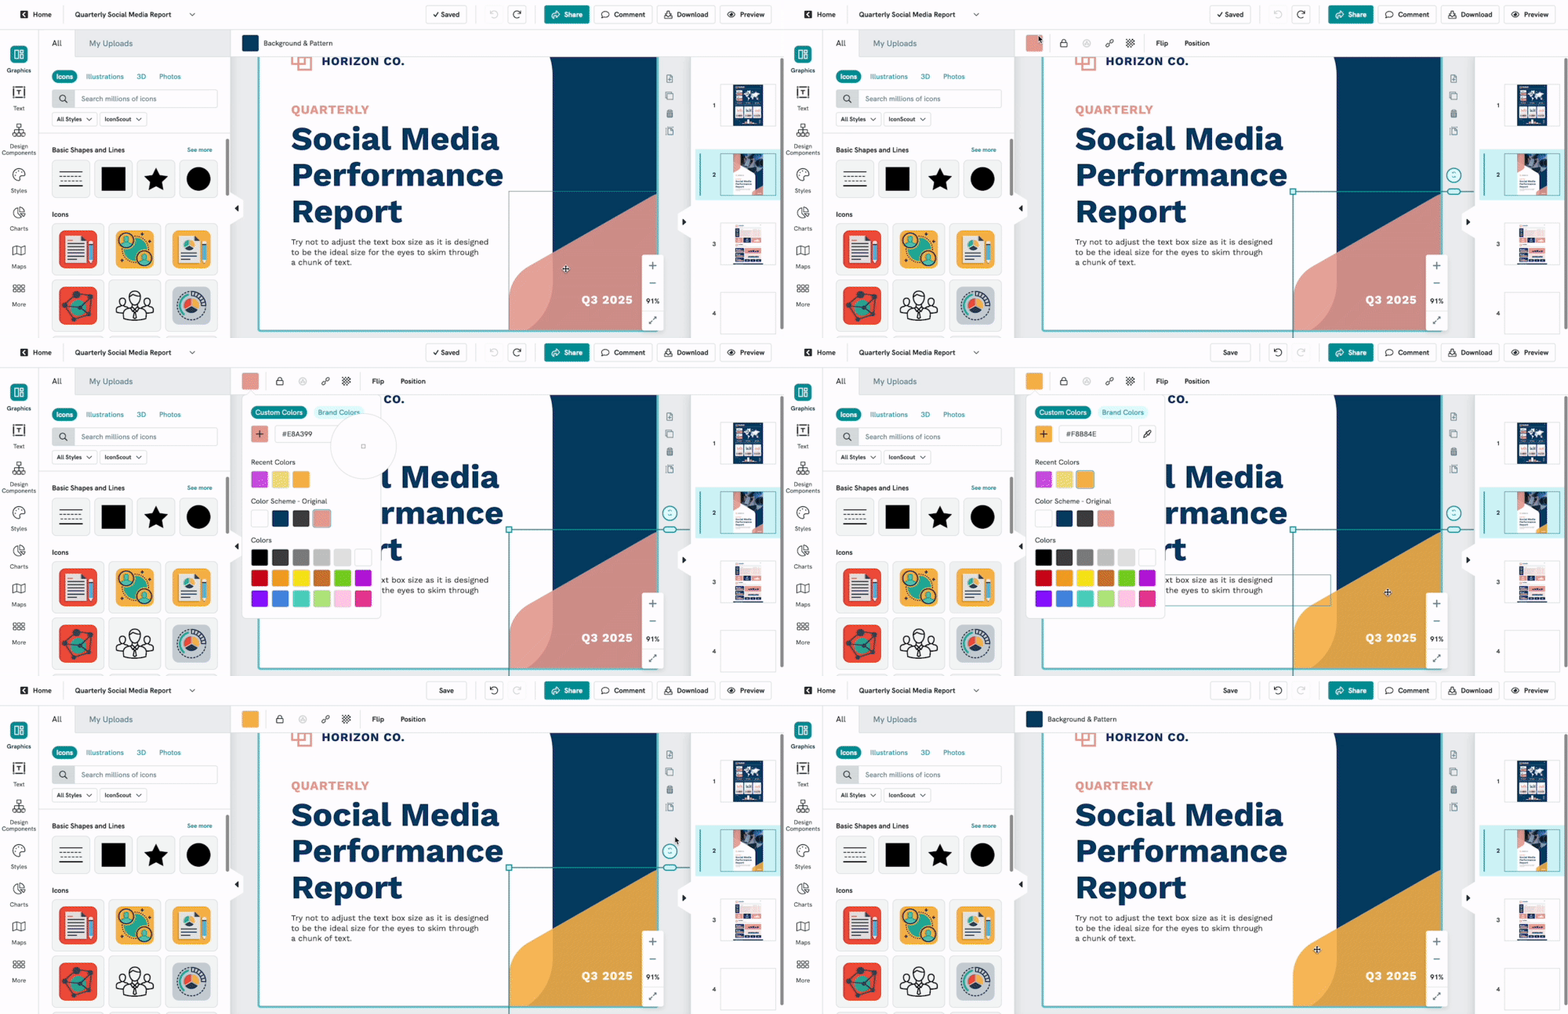
Is there a color you want to use but you're not sure what the HEX code is or how to search for it? Our Color Dropper tool allows you to select a precise color from any element on a website. Check out our guide here!
Tables
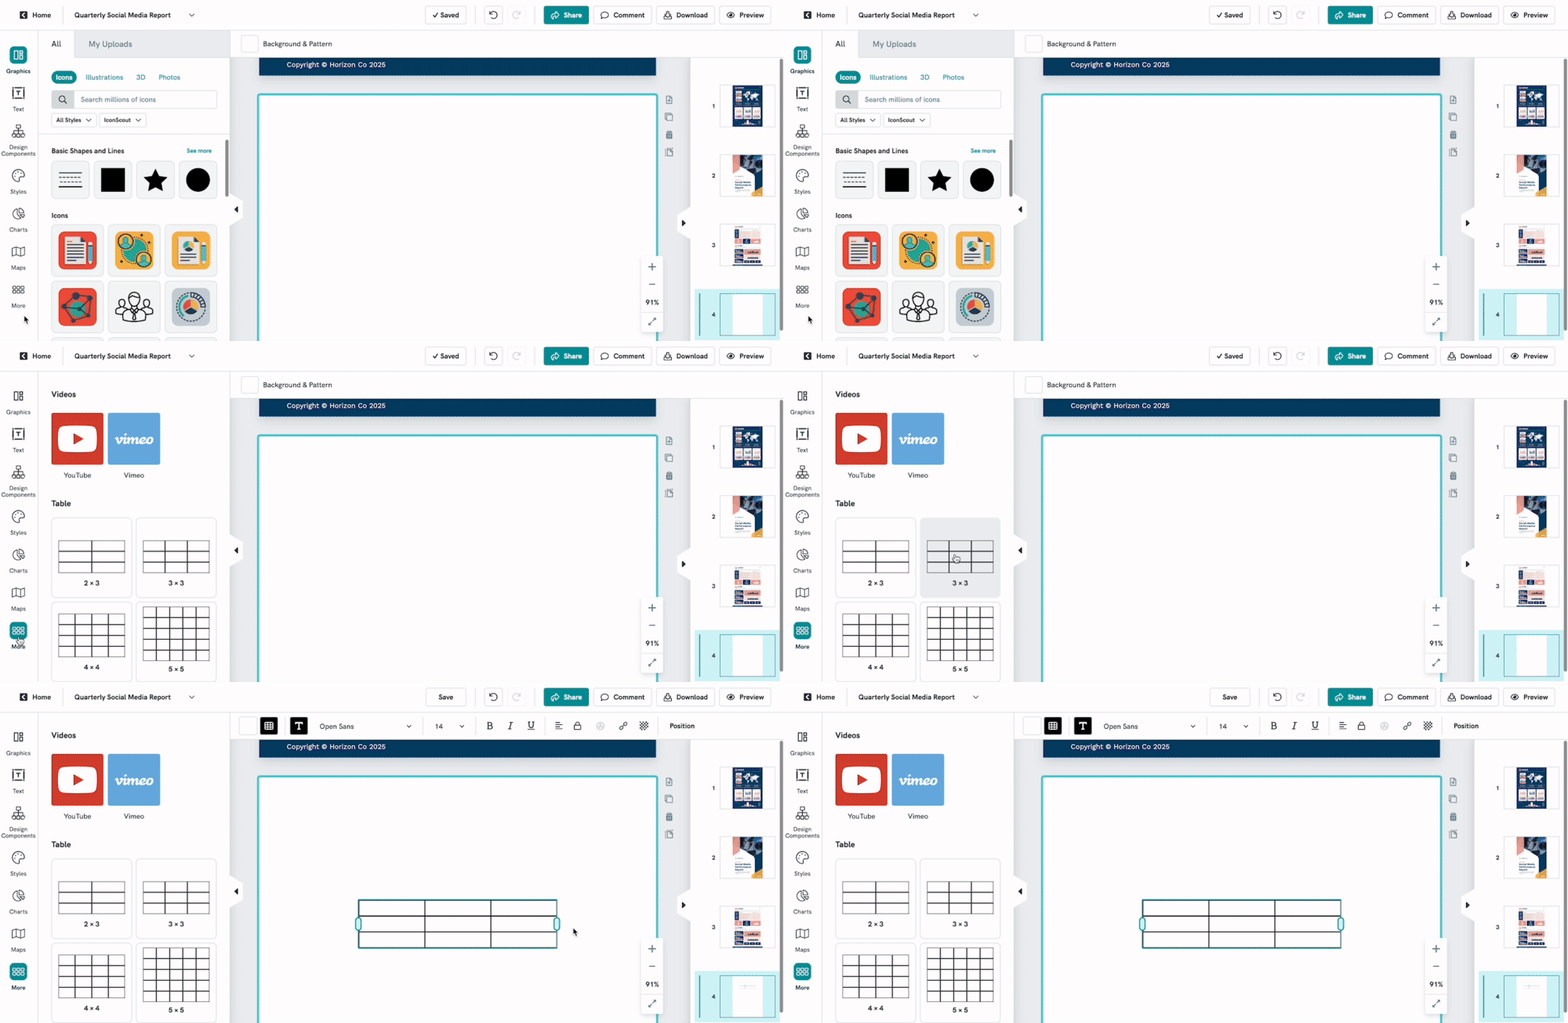
You can insert a table by clicking on the More option at the bottom of the left panel menu and edit the table by double-clicking on it and entering your data. It's easily accessible and simple to edit or customize your table.
Color Schemes Improvement
To access your Color Schemes, click on the Colors option on the left panel menu and select from built-in designer color schemes or create your own! These color schemes can be saved and reused across other visuals.

Charts Improvements
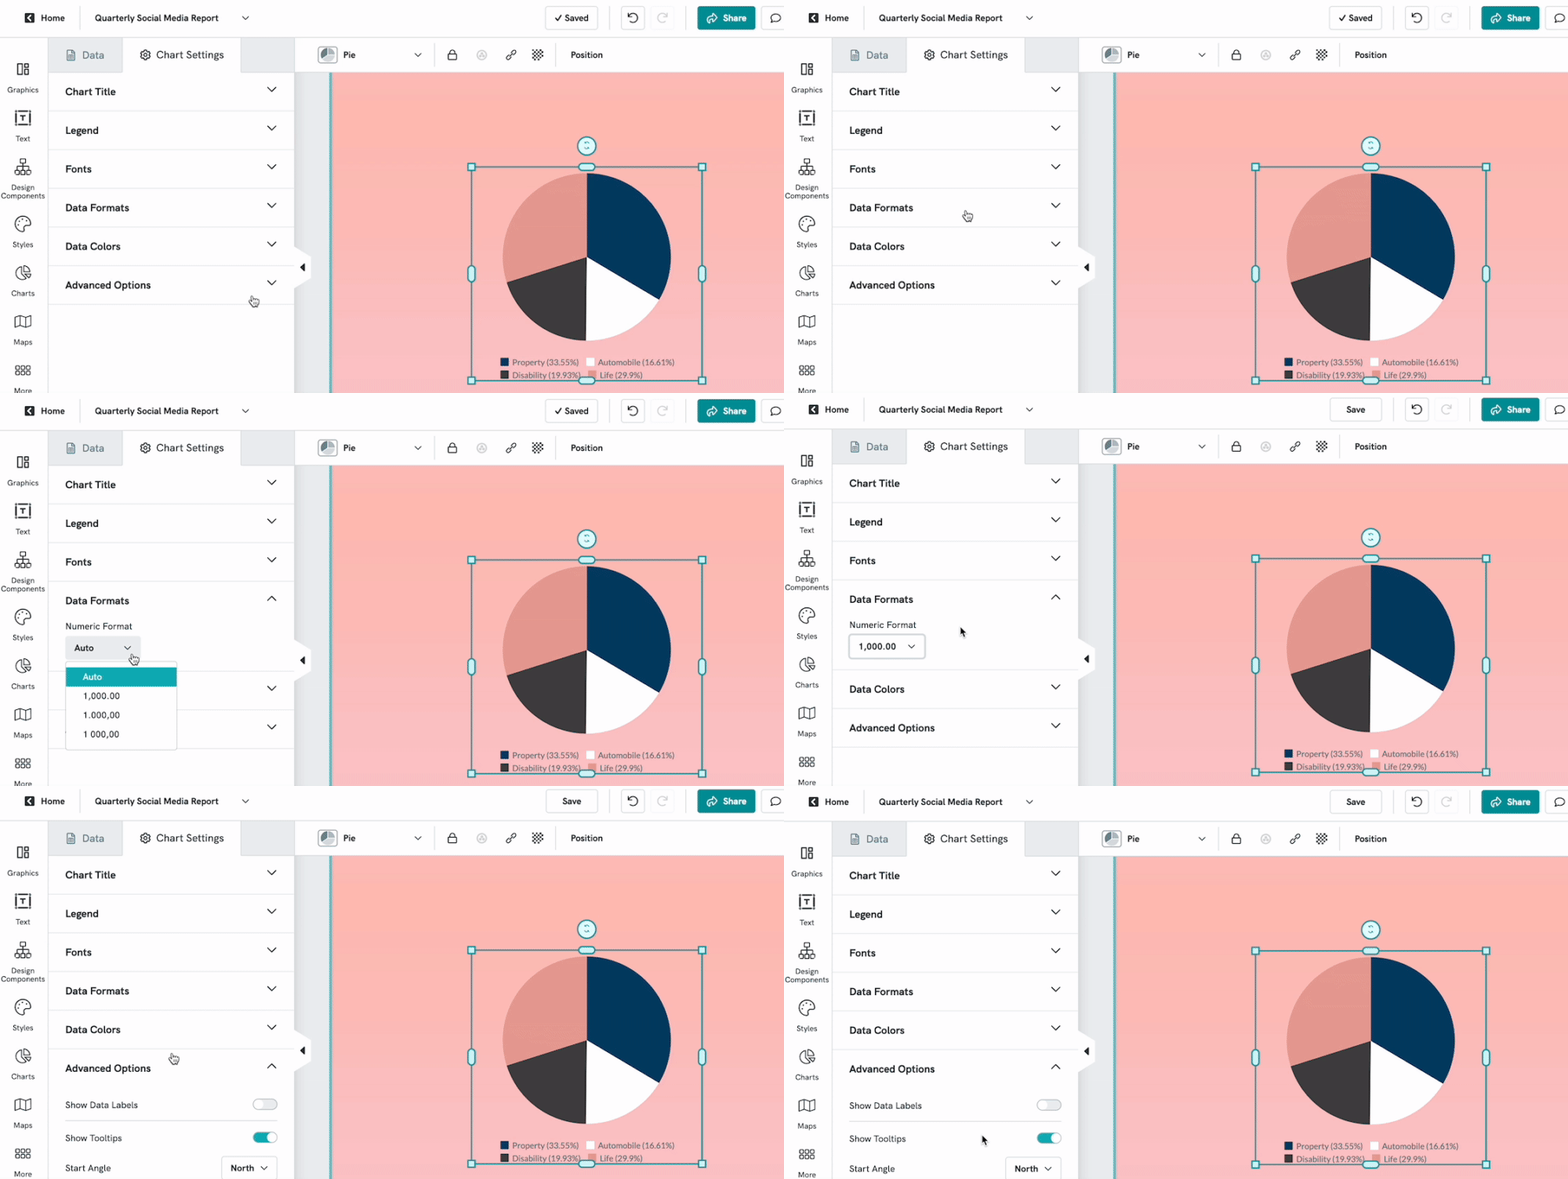
Chart Settings include the ability to select your data format, and data colors, and choose from advanced options (toggle on or off the data labels, show tooltips, etc.) Customizing your chart is now a straightforward and simple mission!
My Uploads
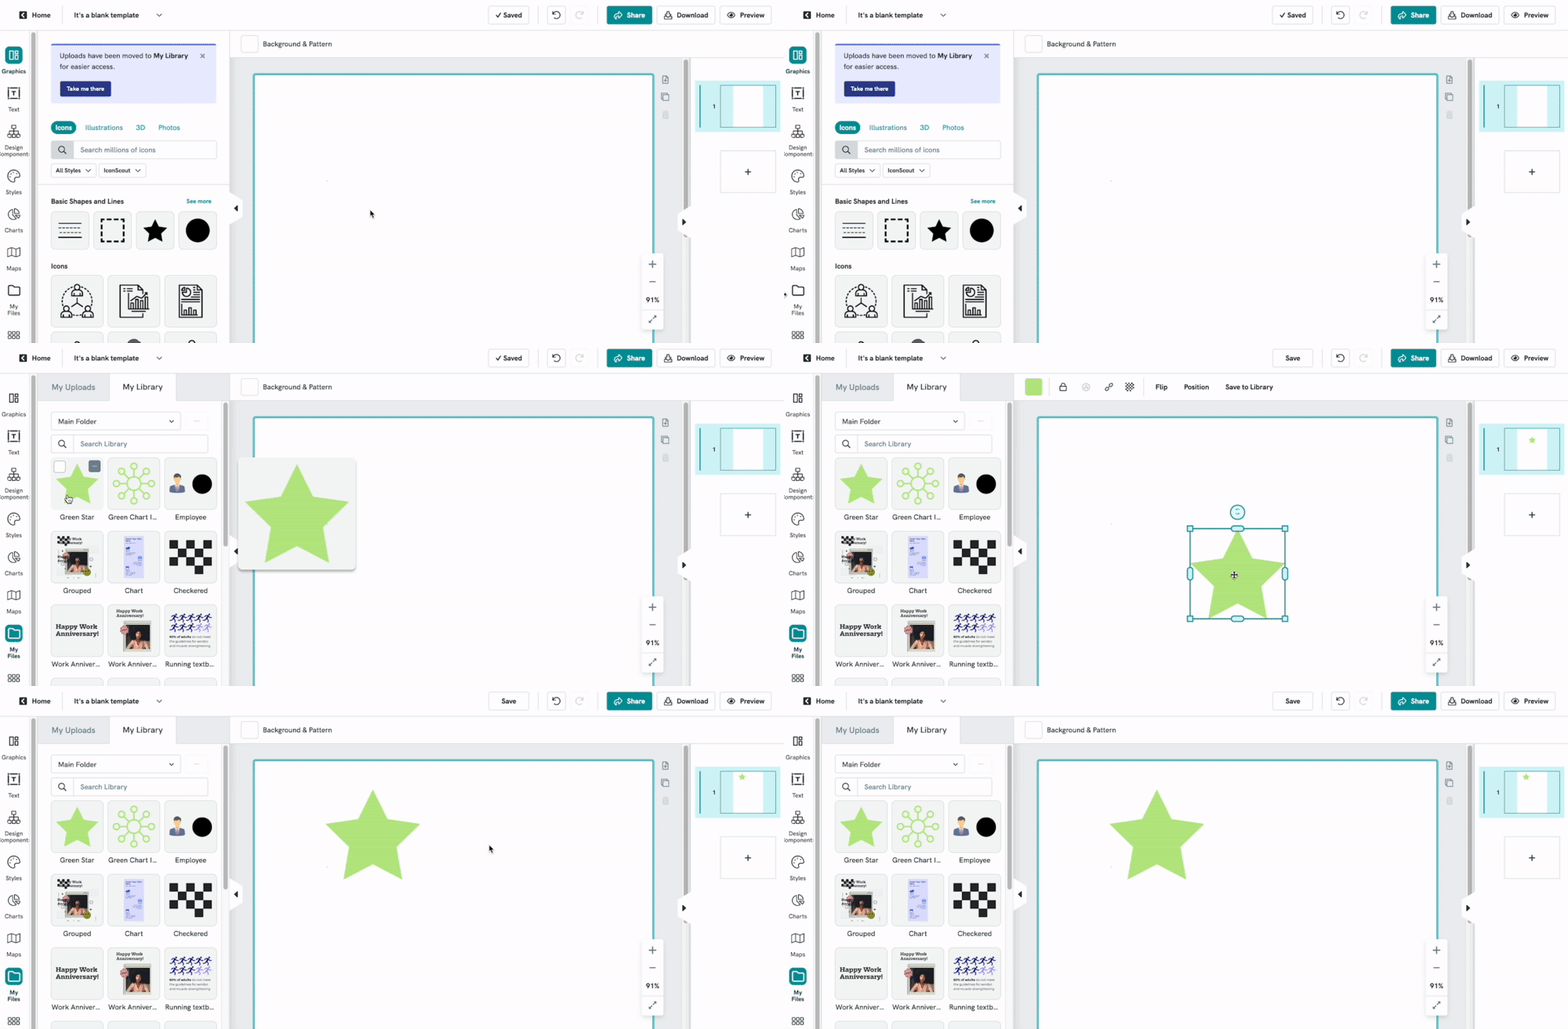
All of your uploads will be accessible from the My Files section on the left panel menu. Paying users will be able to edit, save, and reuse assets such as icons, images, and other graphics in the My Library section!
Adding, Deleting, and Rearranging Your Pages
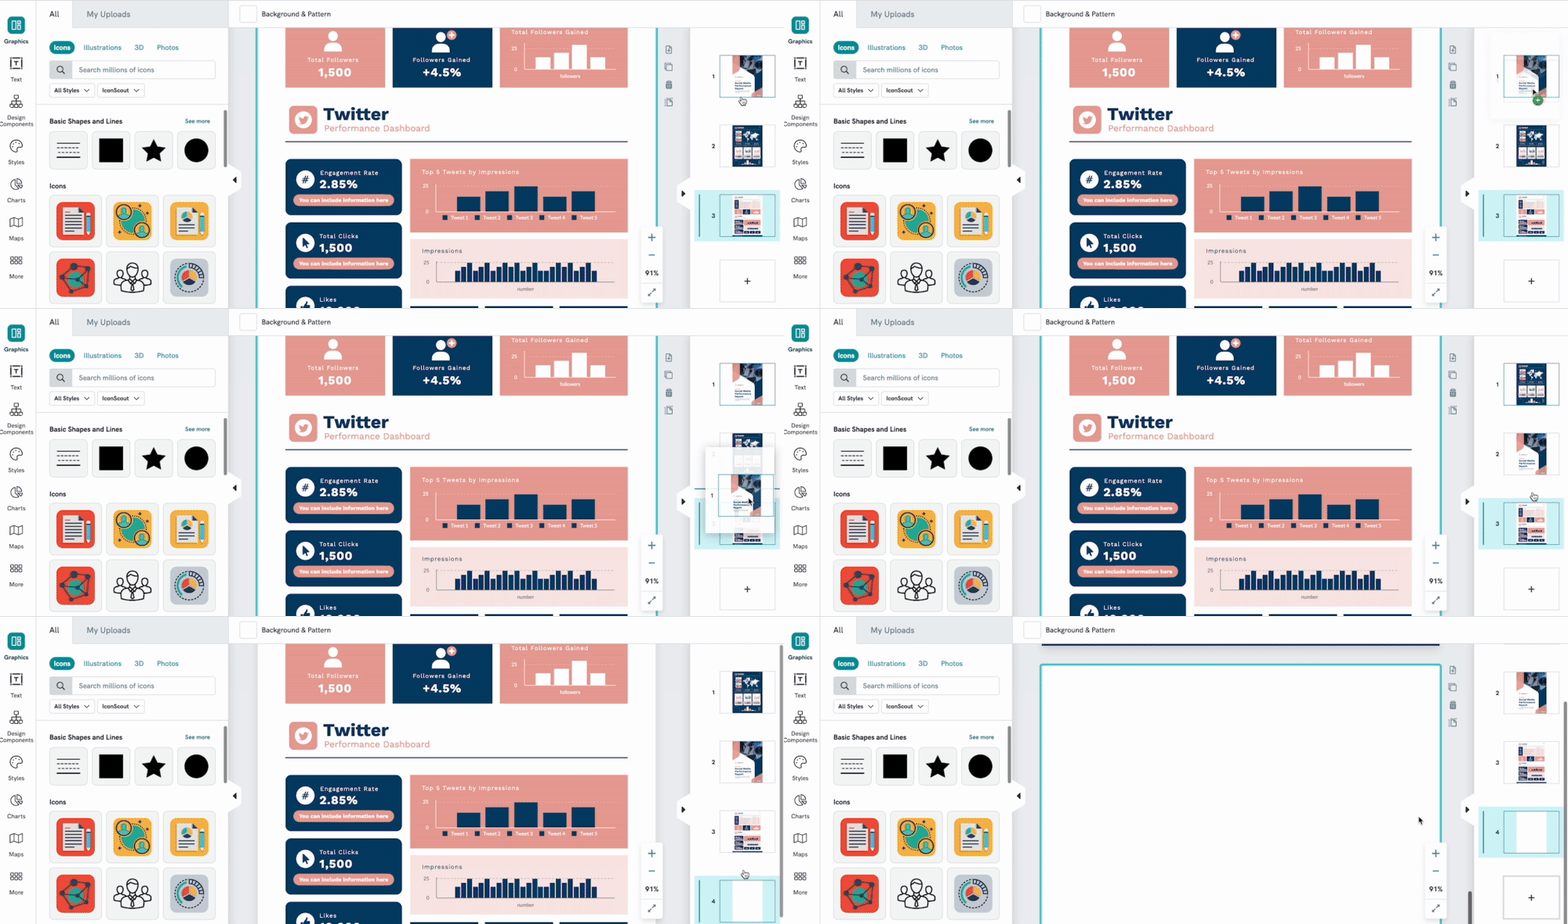
You can easily rearrange, add, or delete pages in your visual. Check out our video tutorial and quick guide for this here.
Easily Replace Images
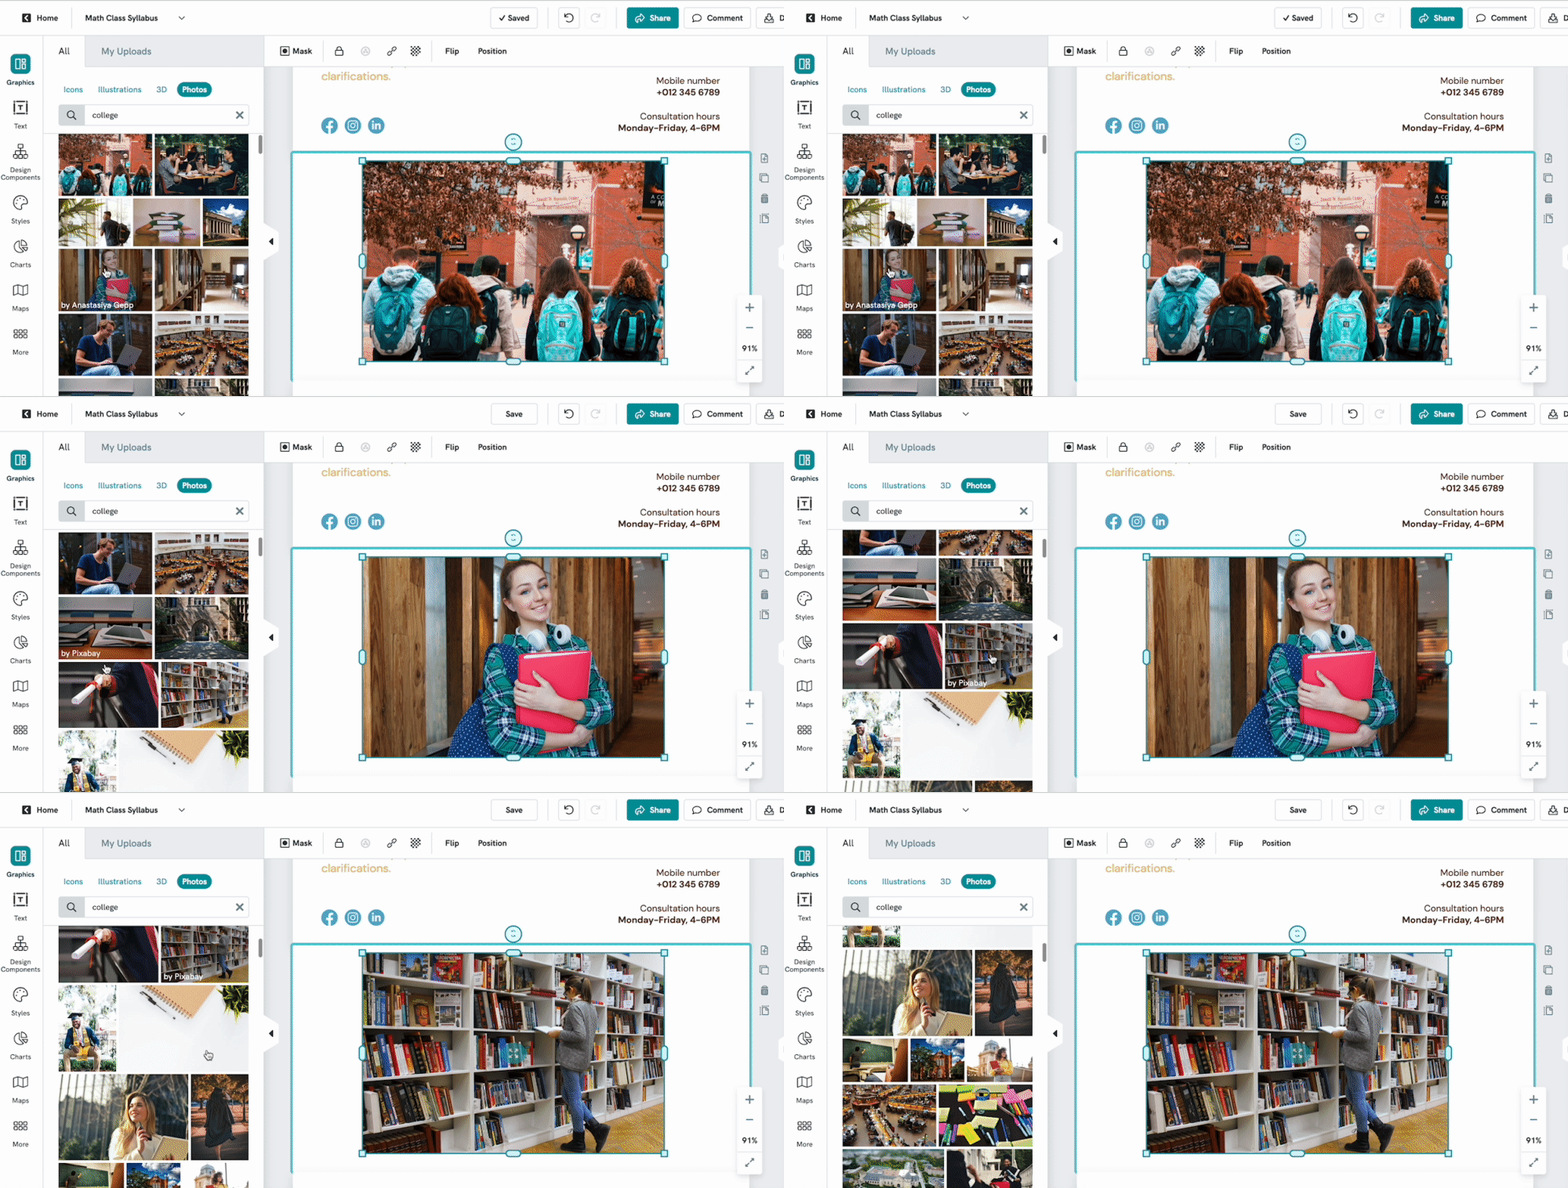
It's now easier than ever to swiftly replace the images in your canvas with just one click!
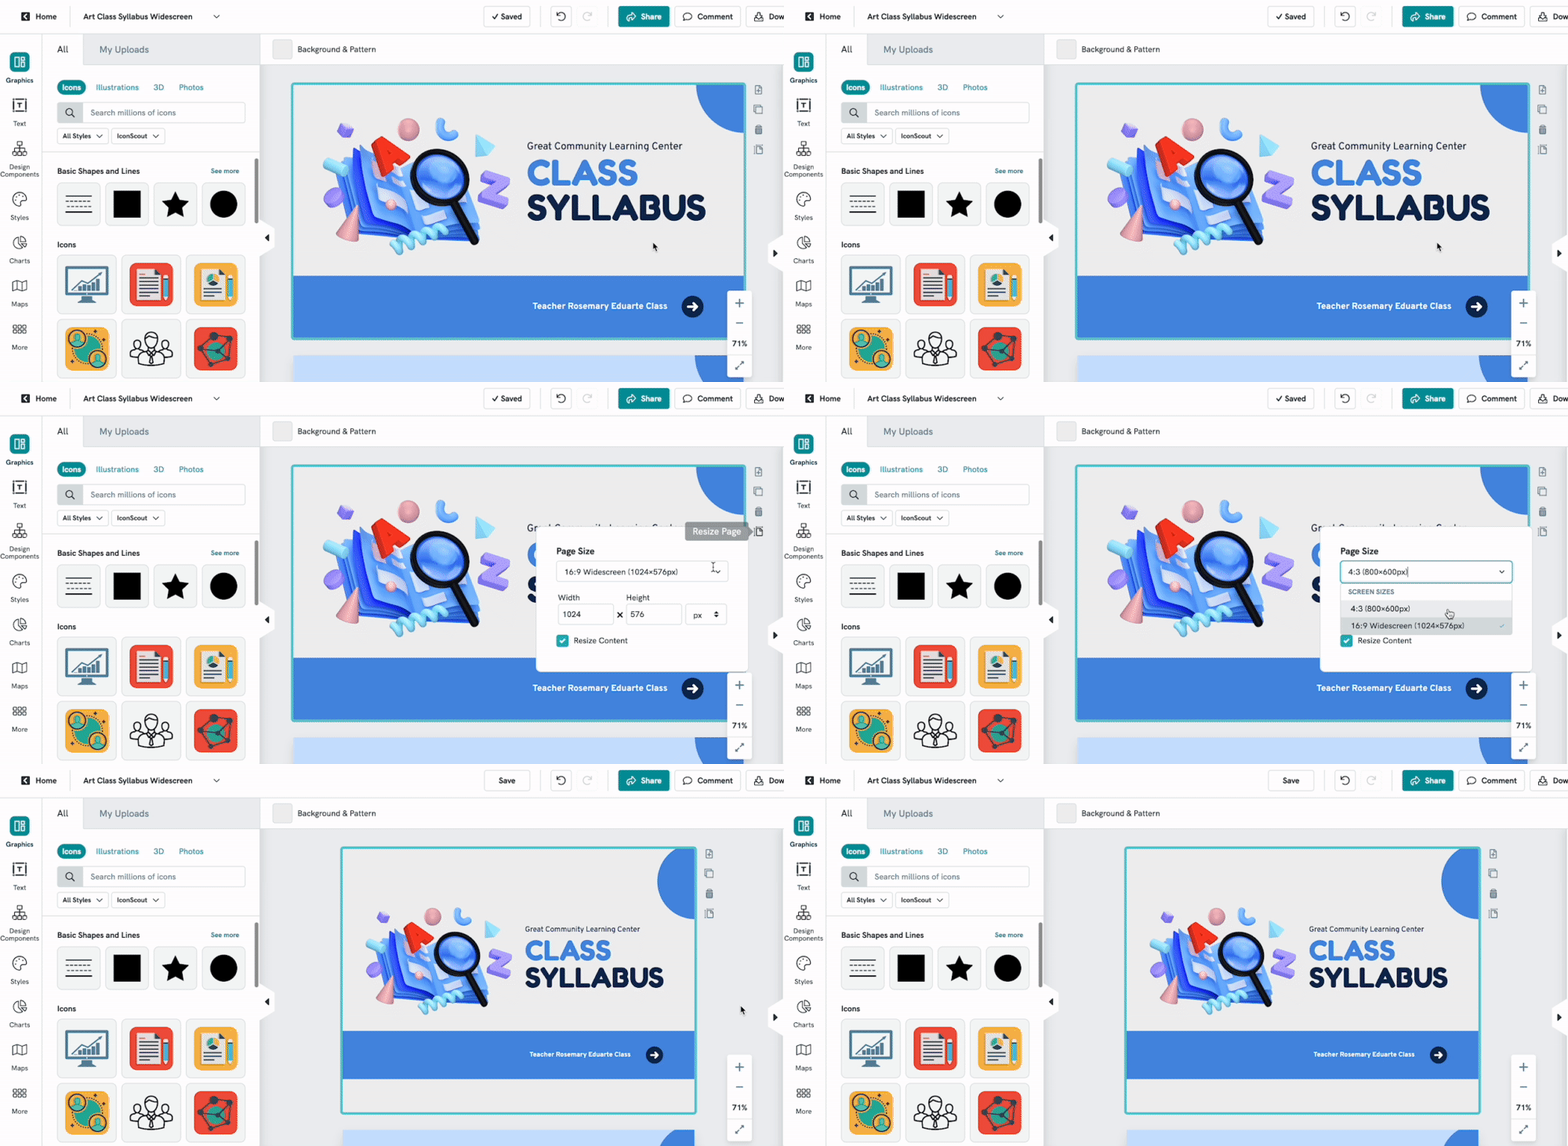
Resizing of Presentation format
With the new editor, it's possible to resize your Presentation pages to either the 4:3 ratio format or the 16:9 ratio format.
