How to Generate Visual with Pikto AI ⚡
IN THIS ARTICLE
Piktochart AI helps you create professional visuals in seconds—no design experience needed. Simply enter your idea, and the AI will generate ready-made designs for you to customize.
Getting Started
- Go to Pikto AI: https://piktochart.com/generative-ai/editor/
- Log in to your Piktochart account (or sign up if you’re new).
Generate Your Visual
STEP 1: Choose a format
Select the type of visual you want to create:
- Infographic
- Presentation
- Report
- Poster
- Flyer
- Social media post

Pick the type of visual format based on your use case, that you'd like to generate:
| Format | Description /Use Case |
| Infographics | One pager. Use this format to communicate information visually and tell a story using data, icons, and visuals. |
| Optimized for printing, this format is best when your visual needs to be distributed physically such as brochures, flyers and poster. | |
| Social Media | Designed to fit perfectly on social platforms, this format is ideal for eye-catching and shareable content. |
| Presentation | Use this format when you need to present ideas clearly and professionally in a slide-by-slide format. |
| Document | Multi-page. Best for more text-heavy content that still needs visual structure. |
| Image | Use this feature to generate original images based on your description or to edit any photo by enhancing, modifying, or customizing it to fit your needs. |
STEP 2: Enter your prompt
There are 3 ways to enter your prompt.
- Type a short title or description of the visual you want to create in the space.

💡 NOTE:
- Pikto AI’s Visual Generator works best when you focus on what the visual is about, rather than how it should be structured.
- The AI does not follow layout, page, or formatting instructions
- You can customize the design, layout, and structure after generation using the editor
- Paste Text - You can also copy and paste your content directly into the input box.

- Upload a Document: Upload a document for Pikto AI to summarize and visualize.

💡 NOTE
If you want to ensure all of your uploaded or pasted text is retained:
- Select the Document format
- Enable the Preserve Content feature.
For detailed instructions: Preserve Your Uploaded Content
STEP 3: Input Additional Instructions

For visual generation, add enhancement by providing more context to your topic:
- Specify the tone (i.e professional, casual, academic)
- Describe the target audience ( i.e. investors, teachers, students )
- Indicate preferred content language (i.e. translate to Chinese, Spanish, French, etc)
- Focus on content and context, not layout or formatting, since the AI can’t fully interpret specific action prompts such as “3-column layout” or “3 A4 pages."
Currently, Pikto AI isn’t able to fully interpret detailed instruction-based prompts such as:
- Specific layouts (e.g., “Use a 3-column layout”)
- Exact color preferences (e.g., “Apply a dark color scheme”)
- Defined dimensions or page counts (e.g., “Create a 3-page A4 brochure”)
These elements can be adjusted after generation using the Editor.
STEP 4: Generate Visual
- Once you have your content, click Generate Visual to generate.

STEP 5: Select a Template

- Pikto AI will generate multiple template options based on your input.
- Browse the suggested templates and select one that best suits your needs.
- You may preview your selection on the right preview panel.
STEP 6: Update your Content
- Outline: Access the outline feature, make desired modifications and generate the visual with updated structure. See more on Outline.
- Output Language: Make sure the output language is correct. If not, you can still choose your preferred language for the content.

- Edit your image: You can edit images in your Pikto AI-generated visual by opening the Images tab, selecting the image you want to change, and applying your adjustments.

- Select Preferred Color Scheme: Browse through the colors scheme options available and select one that meets your objective.

See more on Color Schemes in AI Generator
STEP 7: Customize your Content
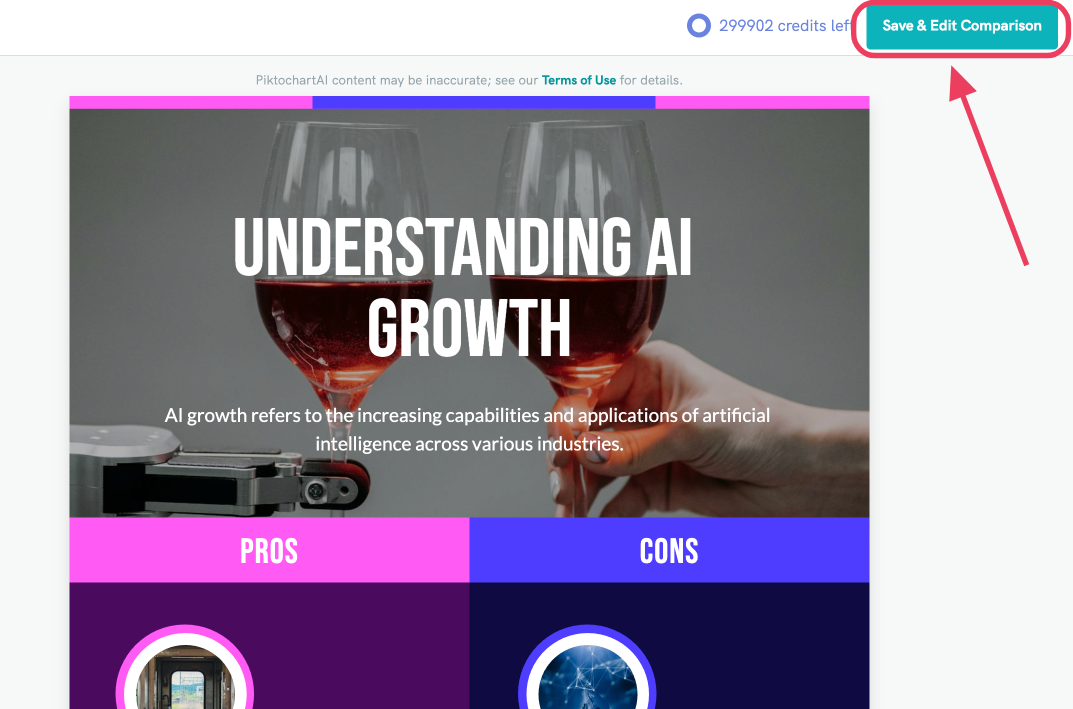
- Click the Save and Edit Visual button on the upper right menu to customize the selected template further in the Editor.
- Click Back if you want to start over with a new prompt.
💡Note
- Create an account or sign in to further edit, download, or share your visuals.
- Your generated visuals are not automatically saved.
- To ensure your work is saved, please click the “Save & Edit” button after generation.
- Once saved, you’ll be able to find your visual in your Home dashboard for future access and editing.
STEP 8: Editing Your Visual
You can further edit and customise your visual in the Editor!
Use Piktochart’s drag-and-drop editor to:
- Add or edit text, images, and icons.
- Adjust colors, fonts, and layouts to match your branding.
- Fine-tune charts or diagrams for accuracy.

Preview your visual to ensure everything looks perfect!
STEP 9: Exporting your Visual
Download your visual by clicking Download button in the top-right corner of the editor.
We support PNG, PDF and PPT export.

Common Questions
Is there a limit to how many times I can use Pikto AI?
The usage of Pikto AI depends on your subscription plan.
Each plan includes a set number of AI credits, which are used every time you generate content with Pikto AI. Once you’ve used all your credits, you may need to upgrade your plan or wait for the next month for your free credits to renew! You can also purchase additional credits here.
For specific details on AI credit limits, please refer to this article.
How do I insert a prompt?
You can insert your prompt directly in the text box on the Pikto AI page, select your format and then type your topic or idea into the prompt field and click “Generate Visual” to get started.
Why am I unable to download more than two times?
Free users have a limit of two downloads and these do not renew. You can upgrade to the Pro or Business plans for unlimited downloads.
Can I upload a document into Pikto AI?
Yes, you can! We support any documents in TXT, DOCX or PDF file. Learn more about how to upload a document here.
How do I insert a new prompt?
Simply click the Back button and key in your prompts again.

Make sure your prompt describes the content you want, not layout or formatting. For example, instead of “Make 3 columns,” describe the topic and key points. You can adjust columns, colors, and pages in the Editor afterward.
If you have any feedback, please free to let us know at [email protected].
Where can I find my visuals after they’re generated?
To make sure your visual is saved, please click the “Save & Edit” button after generation. Once saved, you’ll find it in your Home dashboard, where you can access and edit it anytime.
If you click the Back button and generate a new visual without customizing or saving the current one, it will not be saved to your dashboard.
Does Piktochart offer API access?
At the moment, Piktochart does not offer API access. We understand that API functionality can be valuable for automating workflows, integrating with other tools, or scaling content generation processes. While this feature is not currently available, we’re actively collecting feedback to better understand how users would like to use an API with PiktoAI.
If API access is important for your use case, we’d love to hear more! Please feel free to contact our support team with details about how you’d plan to use the API, so we can share your feedback with our product team.
Can Pikto AI Generate Charts from Raw Data?
At the moment, Pikto AI does not support generating charts directly from raw data (such as CSV files or data tables). However, with our Preserve Content feature, you can now retain charts and tables from your original document when using Pikto AI. This means that while the AI won’t interpret or generate new charts based on raw data, it will visually preserve existing ones in the final output. This will only be available on the Document format.
Can you make or create the visual (e.g. poster, presentation, infographic, flyer) for me?
No. Visuals need to be generated directly by users through the Pikto AI Generator.
Follow these steps to create your visuals:
- Go to Pikto AI Generator.
- Choose your format type – e.g., Report, Presentation, Poster.
- Enter your topic or brief – give the AI a clear description of what content you want to generate. The AI cannot follow layout, page, or formatting instructions.
- Click “Generate” and wait a few moments while the AI creates your visual.
- Review and edit the result as needed to match your style and content.
Can your AI agent create a visual for me as I paste the prompt to chat with AI agent (Mika)?
No, the AI agent can’t directly create visuals.
To generate a visual, please use the Pikto AI Generator. That’s where you can enter your topic, describe what you'd like (such as colors, layout, and key points), and get your visual created in just a few simple steps. Prompts for visual creation should be entered in the Pikto AI Generator.
I have a URL—can you summarize it and convert it into a visual?
If you have a URL, please paste it directly into the prompt box on the Pikto AI Generator. The AI will automatically read the content, summarize it, and generate a visual for you. Just make sure to use the AI Generator—not the chat—for the best results!